Corona Charts – Live COVID-19 Stats WordPress Shortcode Plugin - Rating, Reviews, Demo & Download

Plugin Description
You can use the Corona Charts in your posts, pages, widgets, sidebar, footer and everywhere on your WordPress website.
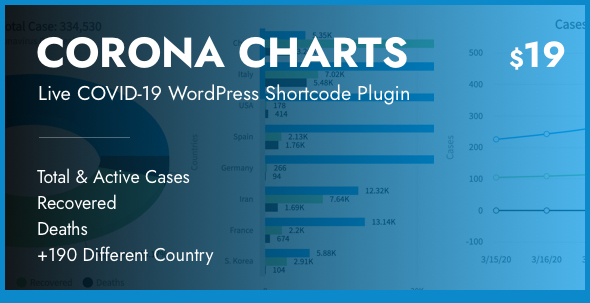
+195 different country & USA states or whole world live Coronavirus pie & doughnut percentage charts.
+195 different country live Coronavirus vertical column charts.
+195 different country or whole world day by day historical Coronavirus line charts.
Live Documentation: http://bakikozak.com/corona-charts/doc
Quick Support: bakikozak@gmail.com
General Features:
- All Charts is Responsive, Mobile & Tablet Compatible
- All Text is Localizable for Your Language (included dynamic values)
- All Charts has Own Grid Option (so, you can list the charts in custom columns)
- All Charts has Own Width & Height Option
- All Data Comes from worldometers.info/coronavirus and It’s updated every 10 minutes
- Clean CODE
General Chart Type:
-
Data
- Whole World Data
- +195 Different Country & USA States Data
-
Data Types
- Total Case Count
- Active Cases Count & Percentage
- Recovered Count & Percentage
- Deaths Count & Percentage
-
Styles
- 2D Doughnut
- 3D Doughnut
- 2D Pie
- 3D Pie
-
Chart Features
- Display Values on a Tooltip
- Slice Chart Parts with Click
Countries Bars Chart Type:
-
Data
- Whole World Data
- +195 Different Country Data
-
Data Types
- Today Cases Count
- Today Deaths Count
- Critical Count
- Total Case Count
- Active Cases Count
- Recovered Count
- Deaths Count
-
Styles
- Seperated Bars – Vertical
- Overlapping Bars – Vertical
-
Chart Features
- Set Country Amount
- Display Values next to the Bars
- Display Values on a Tooltip
- Vertical Scrolling
- Maximum Country Amount in Y Axis for First Chart Initialization
- Hide/Show Bars
Historical Lines Chart Type:
-
Data
- Whole World Data
- +195 Different Country Data
-
Data Types
- Day by Day New Cases Count
- Day by Day Total Case Count
- Day by Day Recovered Count
- Day by Day Death Count
-
Styles
- Sharp Lines
- Supple Lines
-
Chart Features
- Set Date Amount
- Display Values on the Lines
- Display Values on a Collective Tooltip
- Horizontal Scrolling
- Maximum Country Amount in X Axis for First Chart Initialization
- Hide/Show Lines
Changelog:
Version 1.2.0 (28 April 2020 – UTC)
- API Improvements.
Version 1.0.8 (18 April 2020 – UTC)
- API updated for general chart types.
Version 1.0.7 (14 April 2020 – UTC)
- "order_by" option added for countries_bars chart types.
You can sort countries by data type with that option.
Example usage: order_by="total_case".
- "countries" option added for countries_bars chart types.
You can show specific countries with that option.
Example usage: countries="usa,uk,canada,romania,russia,japan".
- USA states added for general chart types.
You can show a USA state data with that option.
Example usage: country="usa_new york", country="usa_florida".
- "date_format" option added for historical_lines chart types.
You can change month and day places with that option.
Example usage: date_format="1".
Version 1.0.5 (01 April 2020 – UTC)
- "data_types" option added for countries_bars & historical_lines chart types.
You can filter and sort data types to show on charts.
Example usage: data_types="today_deaths, total_case" or data_types="new_cases, recovered".
Version 1.0.3 (27 March 2020 – UTC)
- Responsive Improvements.
Version 1.0.2 (26 March 2020 – UTC)
- Historical part of API updated.
Version 1.0.1 (24 March 2020 – UTC)
- Minor Improvements.
Version 1.0.0 (23 March 2020 – UTC)
- Initial Release.


