WP Log Viewer Wordpress Plugin - Rating, Reviews, Demo & Download

Plugin Description
WP Log viewer makes debugging your WordPress site easy and stress free.
Features
Some features of this plugin.
- Admin bar widget
- Toggle debugging with a click
- Smart download
- One click error filtering
- Clear log with one click
- Group and list views
- Sort entries by date
- Auto refresh
- Realtime search
- Error color legend
- Custom errors
- Debugging status, size and last modified
- Dashboard widget
- Persistent settings
Admin Bar Widget
The admin bar widget gives you glanceable information such as debug log mode and error count where ever you are in wp-admin. You will always know when there are errors and can access the log viewer with on click for additional details.
Toggle Debugging
Now you can enable/disable debugging with a click. No need to manually edit wp-config.php anymore. Go to the help section, follow the easy instructions to enable this feature and you are ready to go.
Smart Download
When you click to download debug.log, a smart log version will be downloaded. What is a smart log? It’s a version of debug.log that is similar to group view. Only a the latest unique entry for each error will be included.
This makes it much easier to analyse the file, scan for errors and skip all the redundancy.
One Click Error Filtering
You can filter errors with just one click on the error legend. Click on multiple error types to filter by multiple error types. Click a second time to deselect an error type. This feature works great with custom errors.
Clear Log
Easily clear your debug.log file with one click.
Group View
Log entries are group making it much easier to see each unique error. You can click to list the date and times when the error occured. Grouped entries can be sorted by newest or latest.
List View
All log entries are listed by date and time and can be sorted by newest or latest.
Sort By Date
Log entries can be sorted by date by newest or latest in either list or group views.
Automatic Refresh
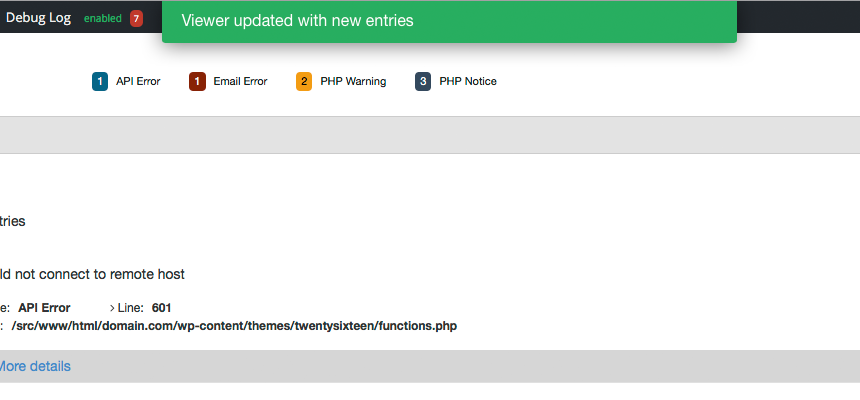
Log automatically refreshes to display new errors. No need to manually refresh the screen. However, there is a link to manually refresh if desired.
Realtime Search
Quickly search and find specific errors.
Error Color Legend
Errors are color coded to make it easier to identify certain errors such as fatal, notices, warnings, deprecated and database.
Custom Errors
Now you can easily define custom error messages. When that error occures in your log file it can have it’s own color coding, count and label. Testing for custom errors or issues is now much easier.
Debug Status
Debugging status is located at the top of the viewer and admin bar to make it easy to see if debugging is enabled or disabled.
You can also see log size and last modified timestamp. This information automatically updates when changed.
Dashboard Widget
This widget gives you a quick summary regarding how many and what type of errors are in the log view. You can also access the log viewer with just one click.
Persistent Settings
Customize your log viewer to your heart’s content. Your settings such as view, sort order, sidebar folding and more persist accross logins. When you login as your user, log viewer will be just like you left it.
Screenshots

** Grouped view ** – Grouped view makes it easier to analyze errors and debug code

** Error details ** – Error message and details are neatly displayed

** Automagically refreshes ** – No need to refresh, new errors will be automatically displayed

** Realtime search ** – Makes finding what you are looking for super easy

** Filter errors ** – Click error types to filter results. Only see what you need

** Admin bar count ** – Easily see when you have errors. Click to go to log viewer

** Settings Pane ** – Customize your experience in one place

** Help section ** – Have questions? Get answers


