Everviz – Charts, Maps And Tables – Interactive And Responsive Wordpress Plugin - Rating, Reviews, Demo & Download
Plugin Description
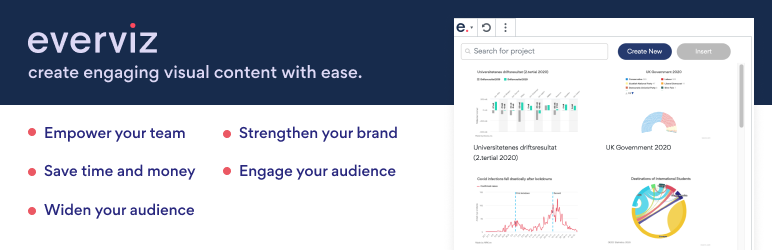
everviz is a data visualization tool that helps you create interactive charts, maps and more – without any coding involved.
Users include newsrooms, communication teams, governments, students and researchers across the globe.
Adding an interactive visualization in your WordPress with everviz is easier than adding an image. Ties perfectly into your existing publishing flow.
All visualizations are fully responsive, which means they automatically adapt and are optimized to all devices and screens of any size. everviz comes with a simple and powerful theme concept, which allows you to incorporate your corporate brand elements such as color palette, fonts, positioning and logos into your projects.
All projects created with everviz include state of the art accessibility (A11Y) functionality in the most relevant disability categories.
This plugin requires an everviz account. Sign up for free here first, if you don’t have one!
HIGHLIGHTS
– Engage readers with interactive content
– No coding or design skills required
– Works on any device
– All your visualizations will be consistent with your brand identity
– Collaborate with your team
– Reach out to bigger audience with state of the art accessibility (A11Y) functionality
– Keep your published work up to date with connecting to live data sources
– Download your visualizations for the print edition or static reports
– Ties perfectly into most popular WordPress editors
HOW TO USE EVERVIZ (PREREQUISITE)
This plugin requires an everviz account and a visualization published in the app. This means that you have to sign up here first and create your first visualization, if you don’t already have an account with published charts or maps.
Here’s how to use everviz to create visualizations from your data:
1. Paste
Enter data directly, drop a CSV file into the editor, copy & paste from Excel, or connect to live data via the Google Sheet integration.
2. Pick
Our intuitive editor lets you choose chart type, edit text, fonts and colors to make your data stand out.
3. Publish
Embed your interactive visualizations on your WordPress website, blog or intranet, or export them as images.
Learn more about how to use everviz in our help section: https://www.everviz.com/help
HOW TO USE THE PLUGIN
Inserting a visualization
If you can’t see the visualization you are looking for, search for it in the search bar at the top of the plugin window or navigate through the pagination at the bottom of the window. When you have identified the visualization you want, click it, and then click the “Insert” button.
Create a new visualization
To create a new visualization, click the “Create new” button at the top of the window. You will be redirected to the everviz app to create the visualization. Go to https://www.everviz.com/help to learn more about how to create visualizations in everviz.
Editing a visualization
To edit a visualization, click “Edit in everviz” below the inserted visualization. You will be redirected to the everviz app.
Deleting a visualization
To delete a visualization from your document, click the trash can symbol in the upper right corner of it.
Screenshots

Link License

Register Account

Choose a project from this list

Chosen Project

Project viewed in your CMS