Glimpse BI Wordpress Plugin - Rating, Reviews, Demo & Download
Plugin Description
Glimpse BI turns your WordPress database into a self-serve BI surface. Build charts and dashboards directly inside wp-admin against your own posts, users, WooCommerce orders, KiviCare appointments, or any other table — without exporting data to a third party.
Every dashboard tile reads through a stale-while-revalidate cache, so multiple admins viewing the same dashboard share one query roundtrip per TTL window. SQL-mode charts pass through an AST-level validator (read-only SELECT/WITH ... SELECT only) before execution, so power users can write hand-tuned queries without giving up safety.
Features:
- No-code chart builder (GUI mode) — pick a table, measure, dimensions, and filters
- SQL mode for hand-written queries — validated server-side, read-only, parameterized
- React-based dashboard grid with 12-column responsive layout (react-grid-layout)
- Runtime parameters per chart (search boxes, date ranges, dropdowns) backed by
wpdb->prepare - Public embed iframes with token auth, rate limiting, and CSV / JSON export
- Built-in dashboard presets — install ready-made dashboards for plugins like KiviCare in one click
- ApexCharts visualizations with a shared design-token theme (KPI, line, bar, pie, table, heatmap, funnel)
- CSV / JSON exports per chart and per dashboard
- Schema introspection with a 1-hour cache and manual refresh
Designed to be polite to your database: query timeouts, row limits (configurable, default 10K), regen-stampede locks, and persistent-object-cache support (auto-detected — uses wp_cache_* when available, transients otherwise).
Source code and build tools
The JavaScript and CSS in assets/build/ are compiled. Their complete, human-readable source ships inside this plugin:
src/— the TypeScript/React source. Each bundle is built from an entry file insrc/entries/:assets/build/admin/frombuilder.tsx,dashboard.tsx,library.tsx,settings.tsxandhost.tsx;assets/build/embed/fromembed.tsxandembed-dashboard.tsx.package.jsonandpackage-lock.json— every JavaScript dependency and its exact version.vite.config.admin.ts,vite.config.embed.ts,postcss.config.js,postcss-glimpsebi-scope.jsandtsconfig.json— the build configuration.
To rebuild the bundles, run these commands in the plugin folder (Node.js 20.19+ or 22.12+):
npm ci
npm run build
The compiled bundles also include these open-source libraries, installed from npm. Their source code is available at:
- React and React DOM — https://github.com/facebook/react
- ApexCharts — https://github.com/apexcharts/apexcharts.js
- react-apexcharts — https://github.com/apexcharts/react-apexcharts
- react-grid-layout — https://github.com/react-grid-layout/react-grid-layout
- CodeMirror — https://github.com/codemirror/dev
- @uiw/react-codemirror — https://github.com/uiwjs/react-codemirror
- Radix UI primitives — https://github.com/radix-ui/primitives
- cmdk — https://github.com/pacocoursey/cmdk
- Lucide icons — https://github.com/lucide-icons/lucide
- next-themes — https://github.com/pacocoursey/next-themes
- Sonner — https://github.com/emilkowalski/sonner
- clsx — https://github.com/lukeed/clsx
- tailwind-merge — https://github.com/dcastil/tailwind-merge
- class-variance-authority — https://github.com/joe-bell/cva
- Tailwind CSS (build tool) — https://github.com/tailwindlabs/tailwindcss
- Vite (build tool) — https://github.com/vitejs/vite
The PHP libraries in vendor/ ship as unmodified source: PHP-SQL-Parser (https://github.com/greenlion/PHP-SQL-Parser) and Vite for WP (https://github.com/kucrut/vite-for-wp). composer.json lists them.
Screenshots
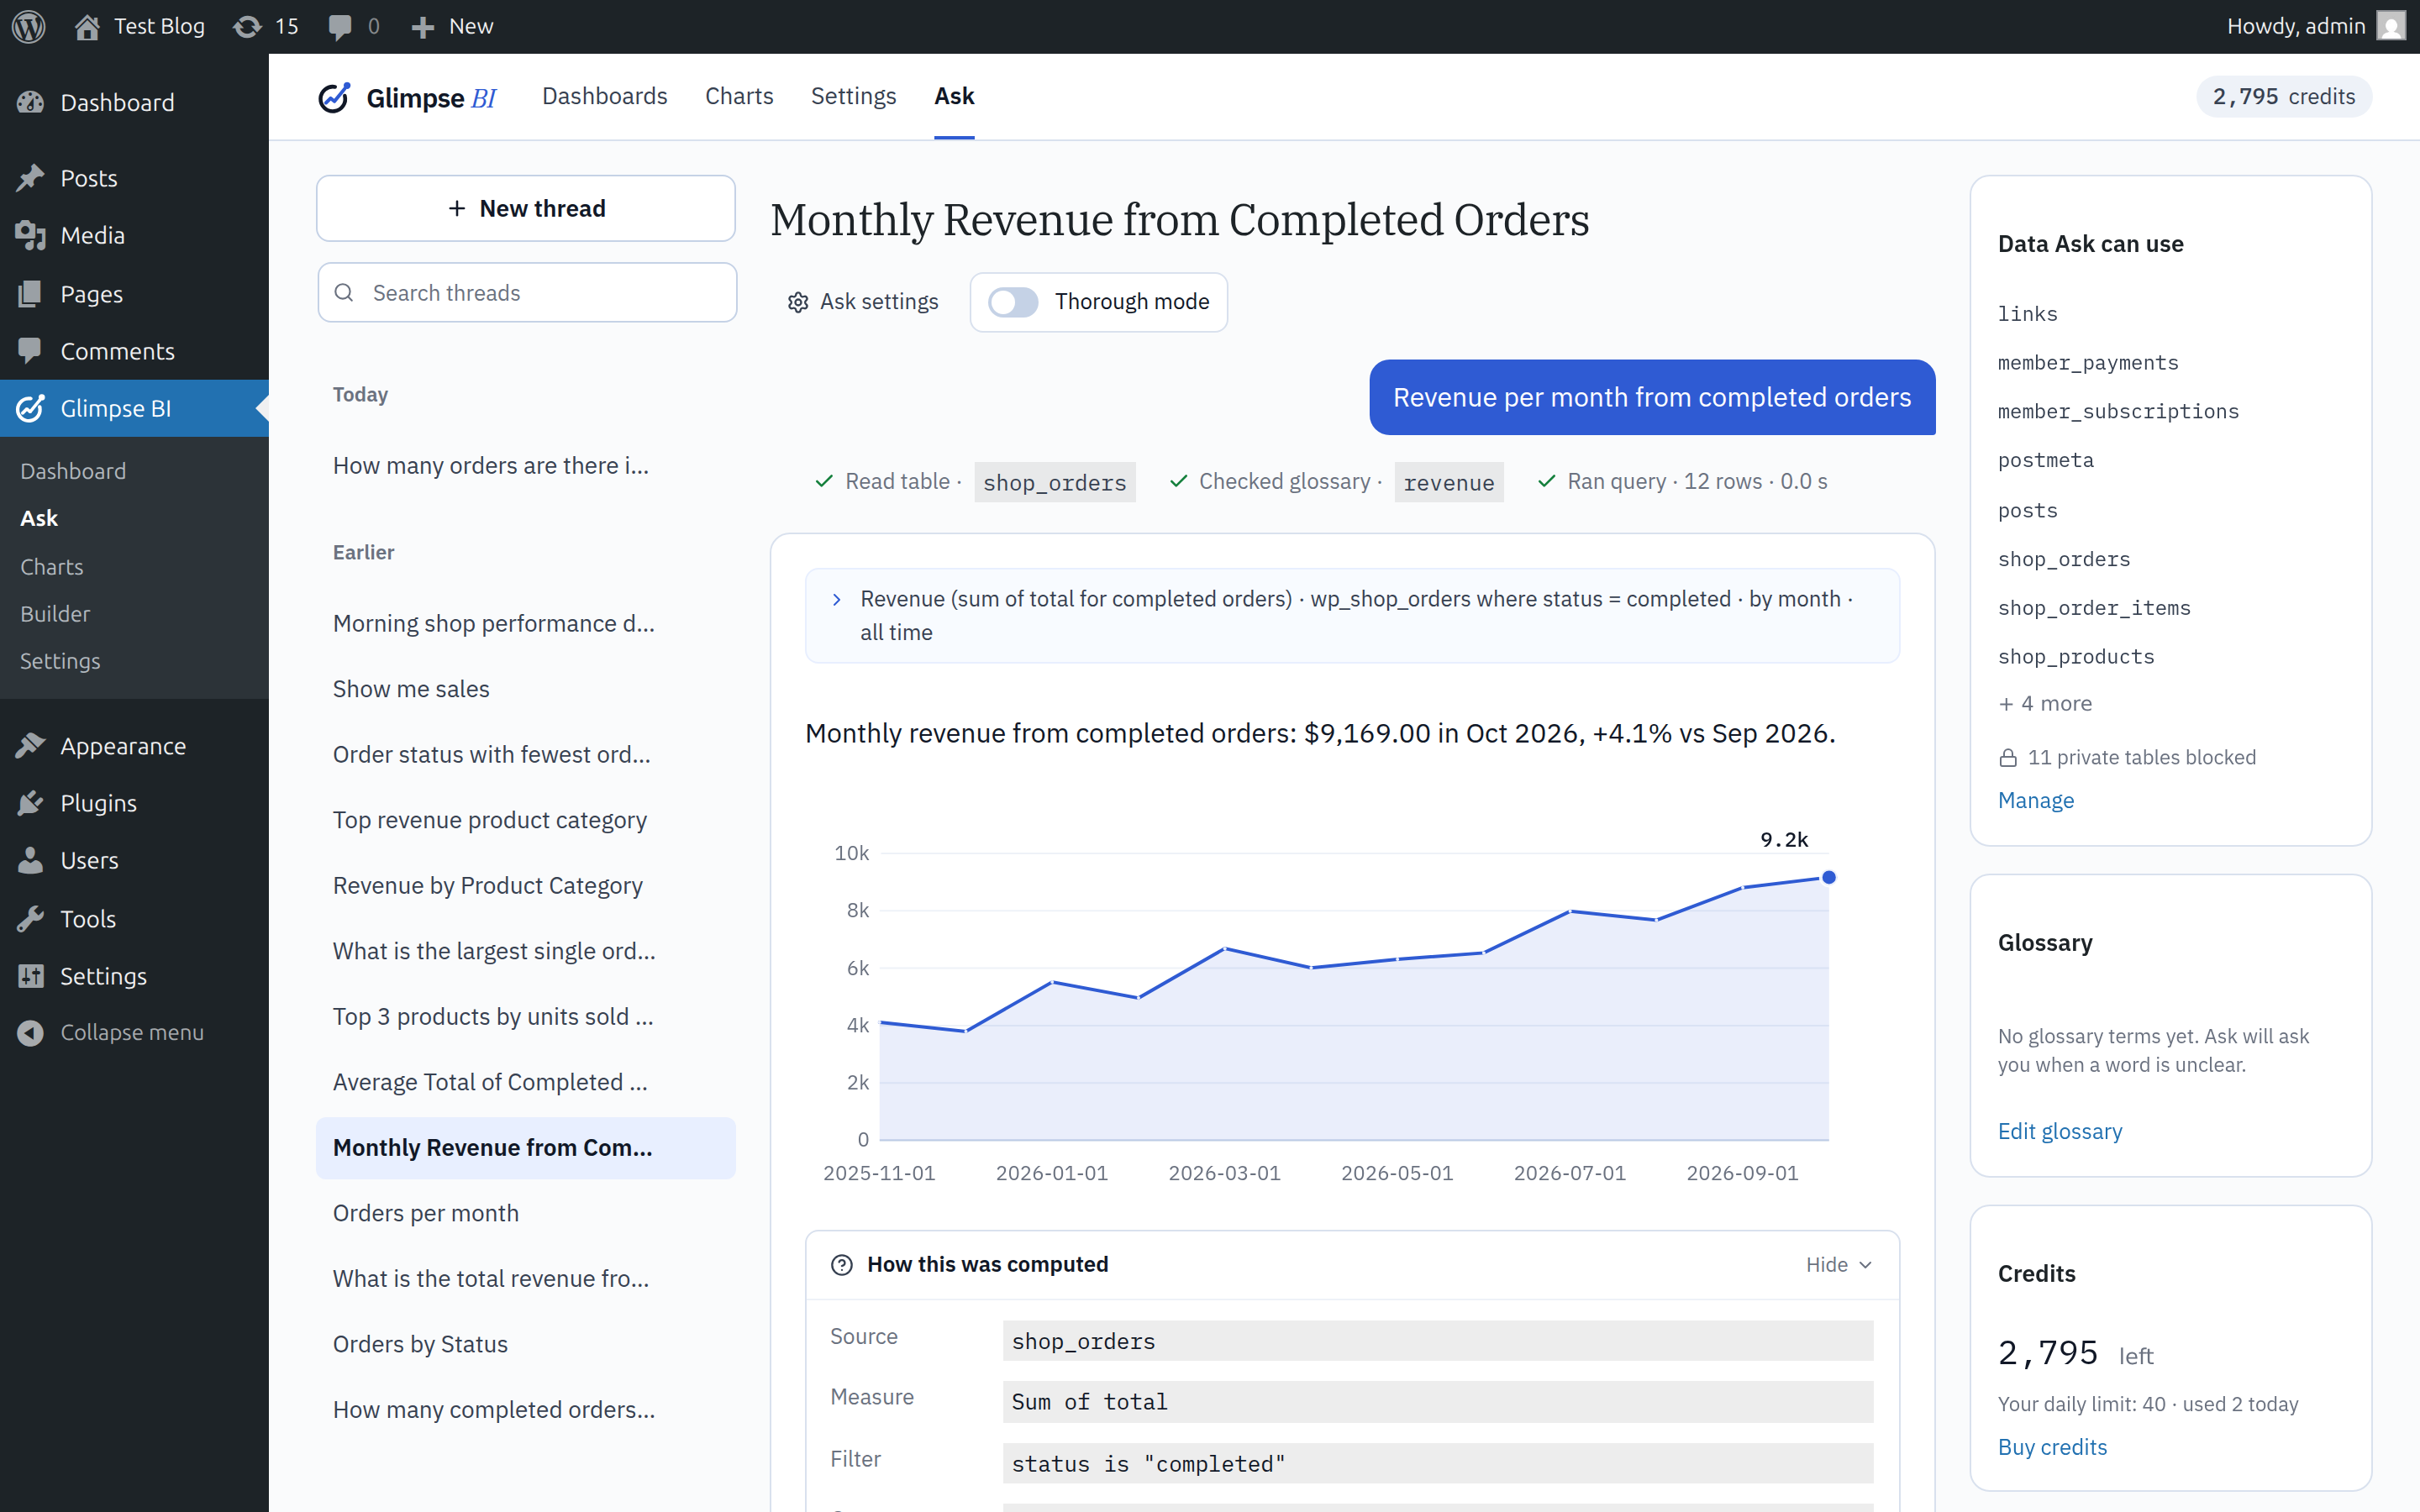
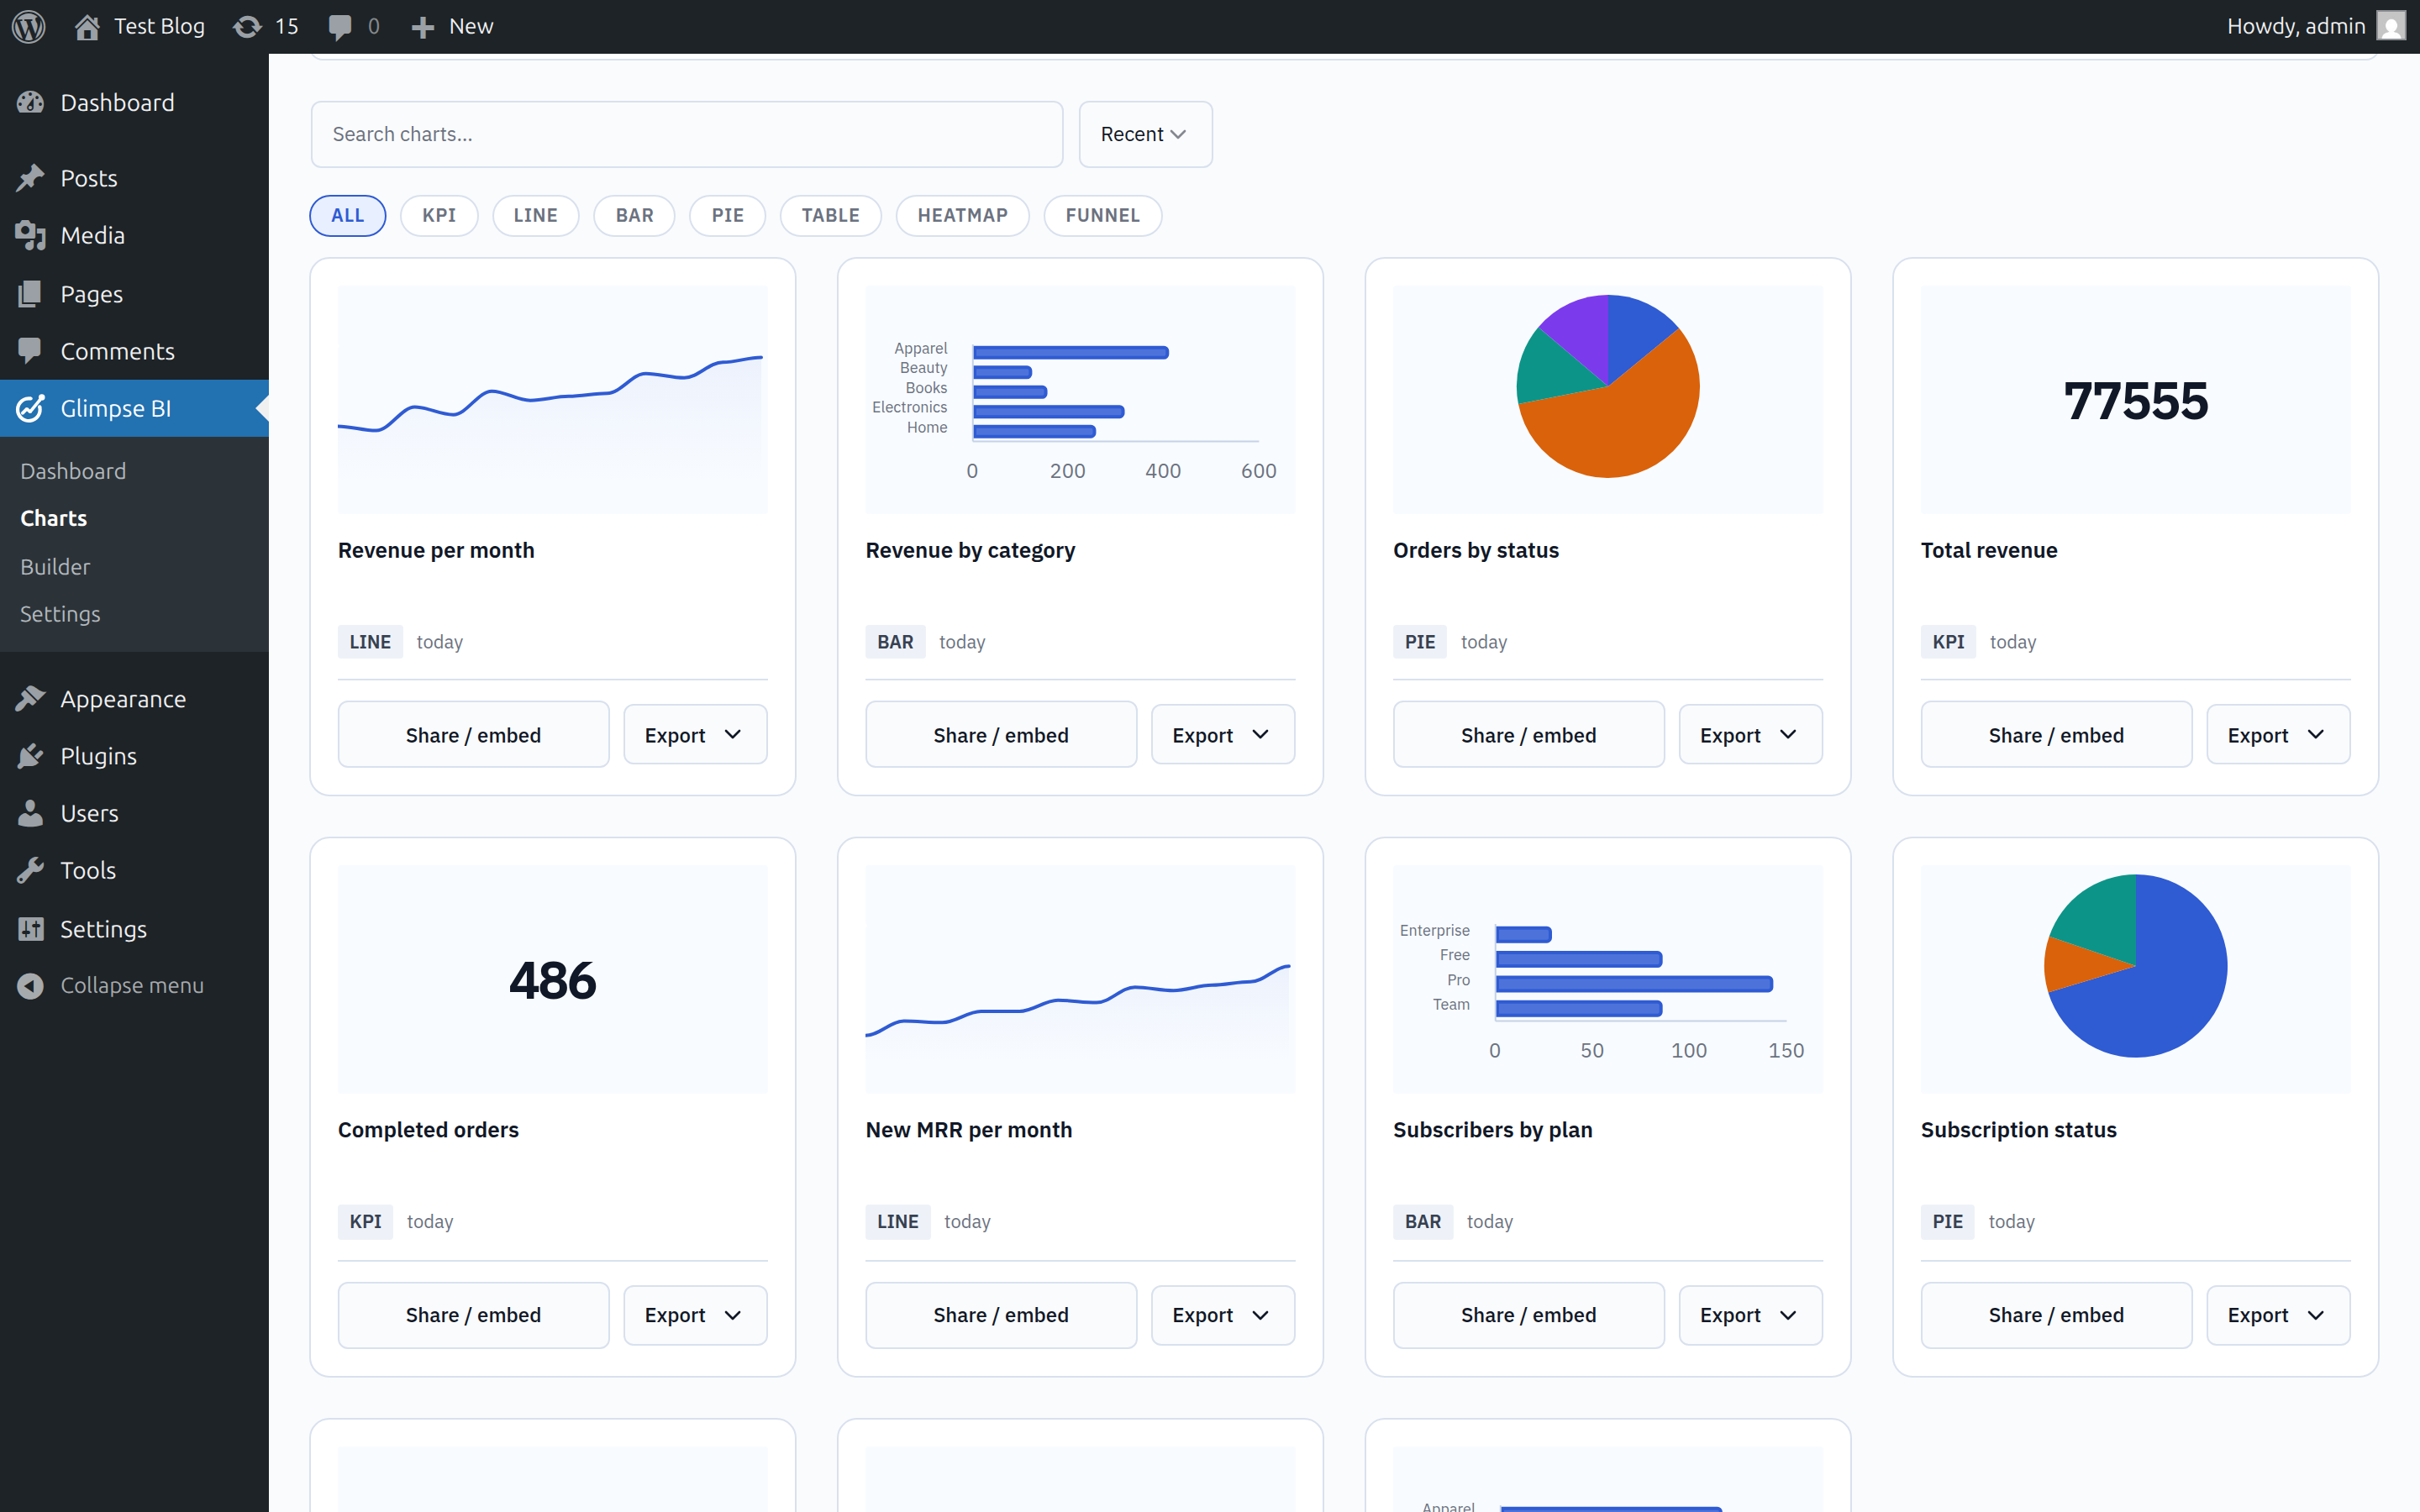
Chart library — browse saved charts with live previews, filter by type, and install a dashboard preset in one click.
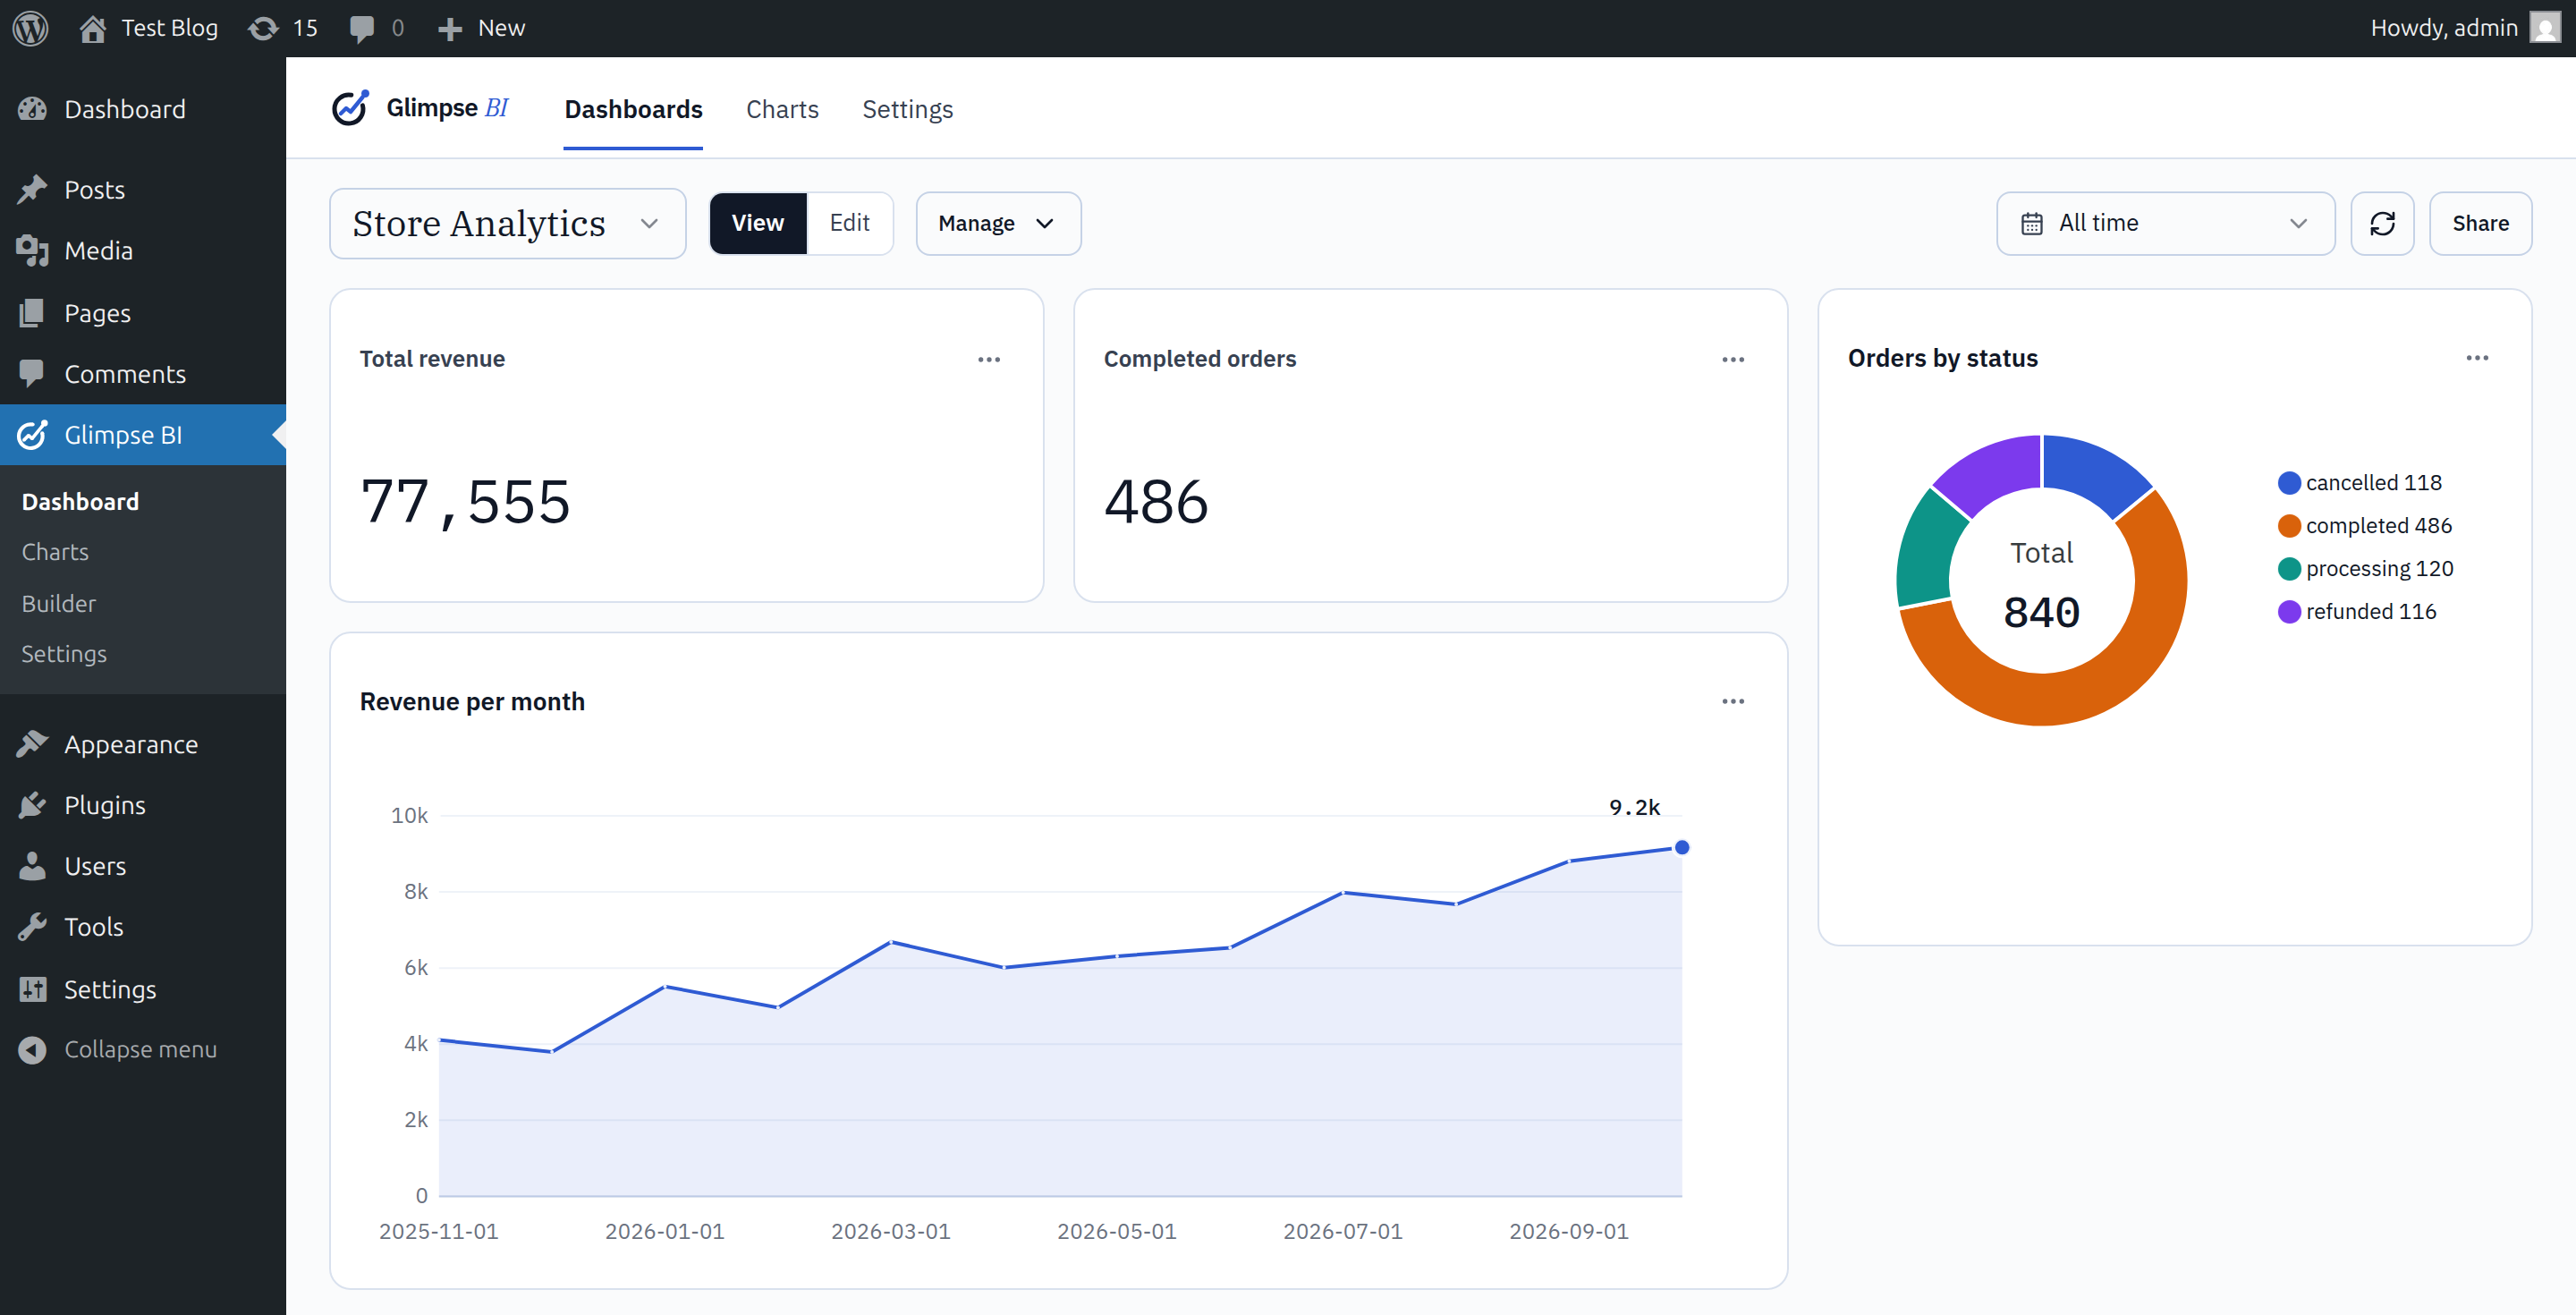
Dashboard — a 12-column grid of KPIs and charts (revenue, orders, average order value, category mix) with a global date-range filter.

Chart builder, GUI mode — pick a table, measure, and dimension to build a chart with a live preview; no SQL required.
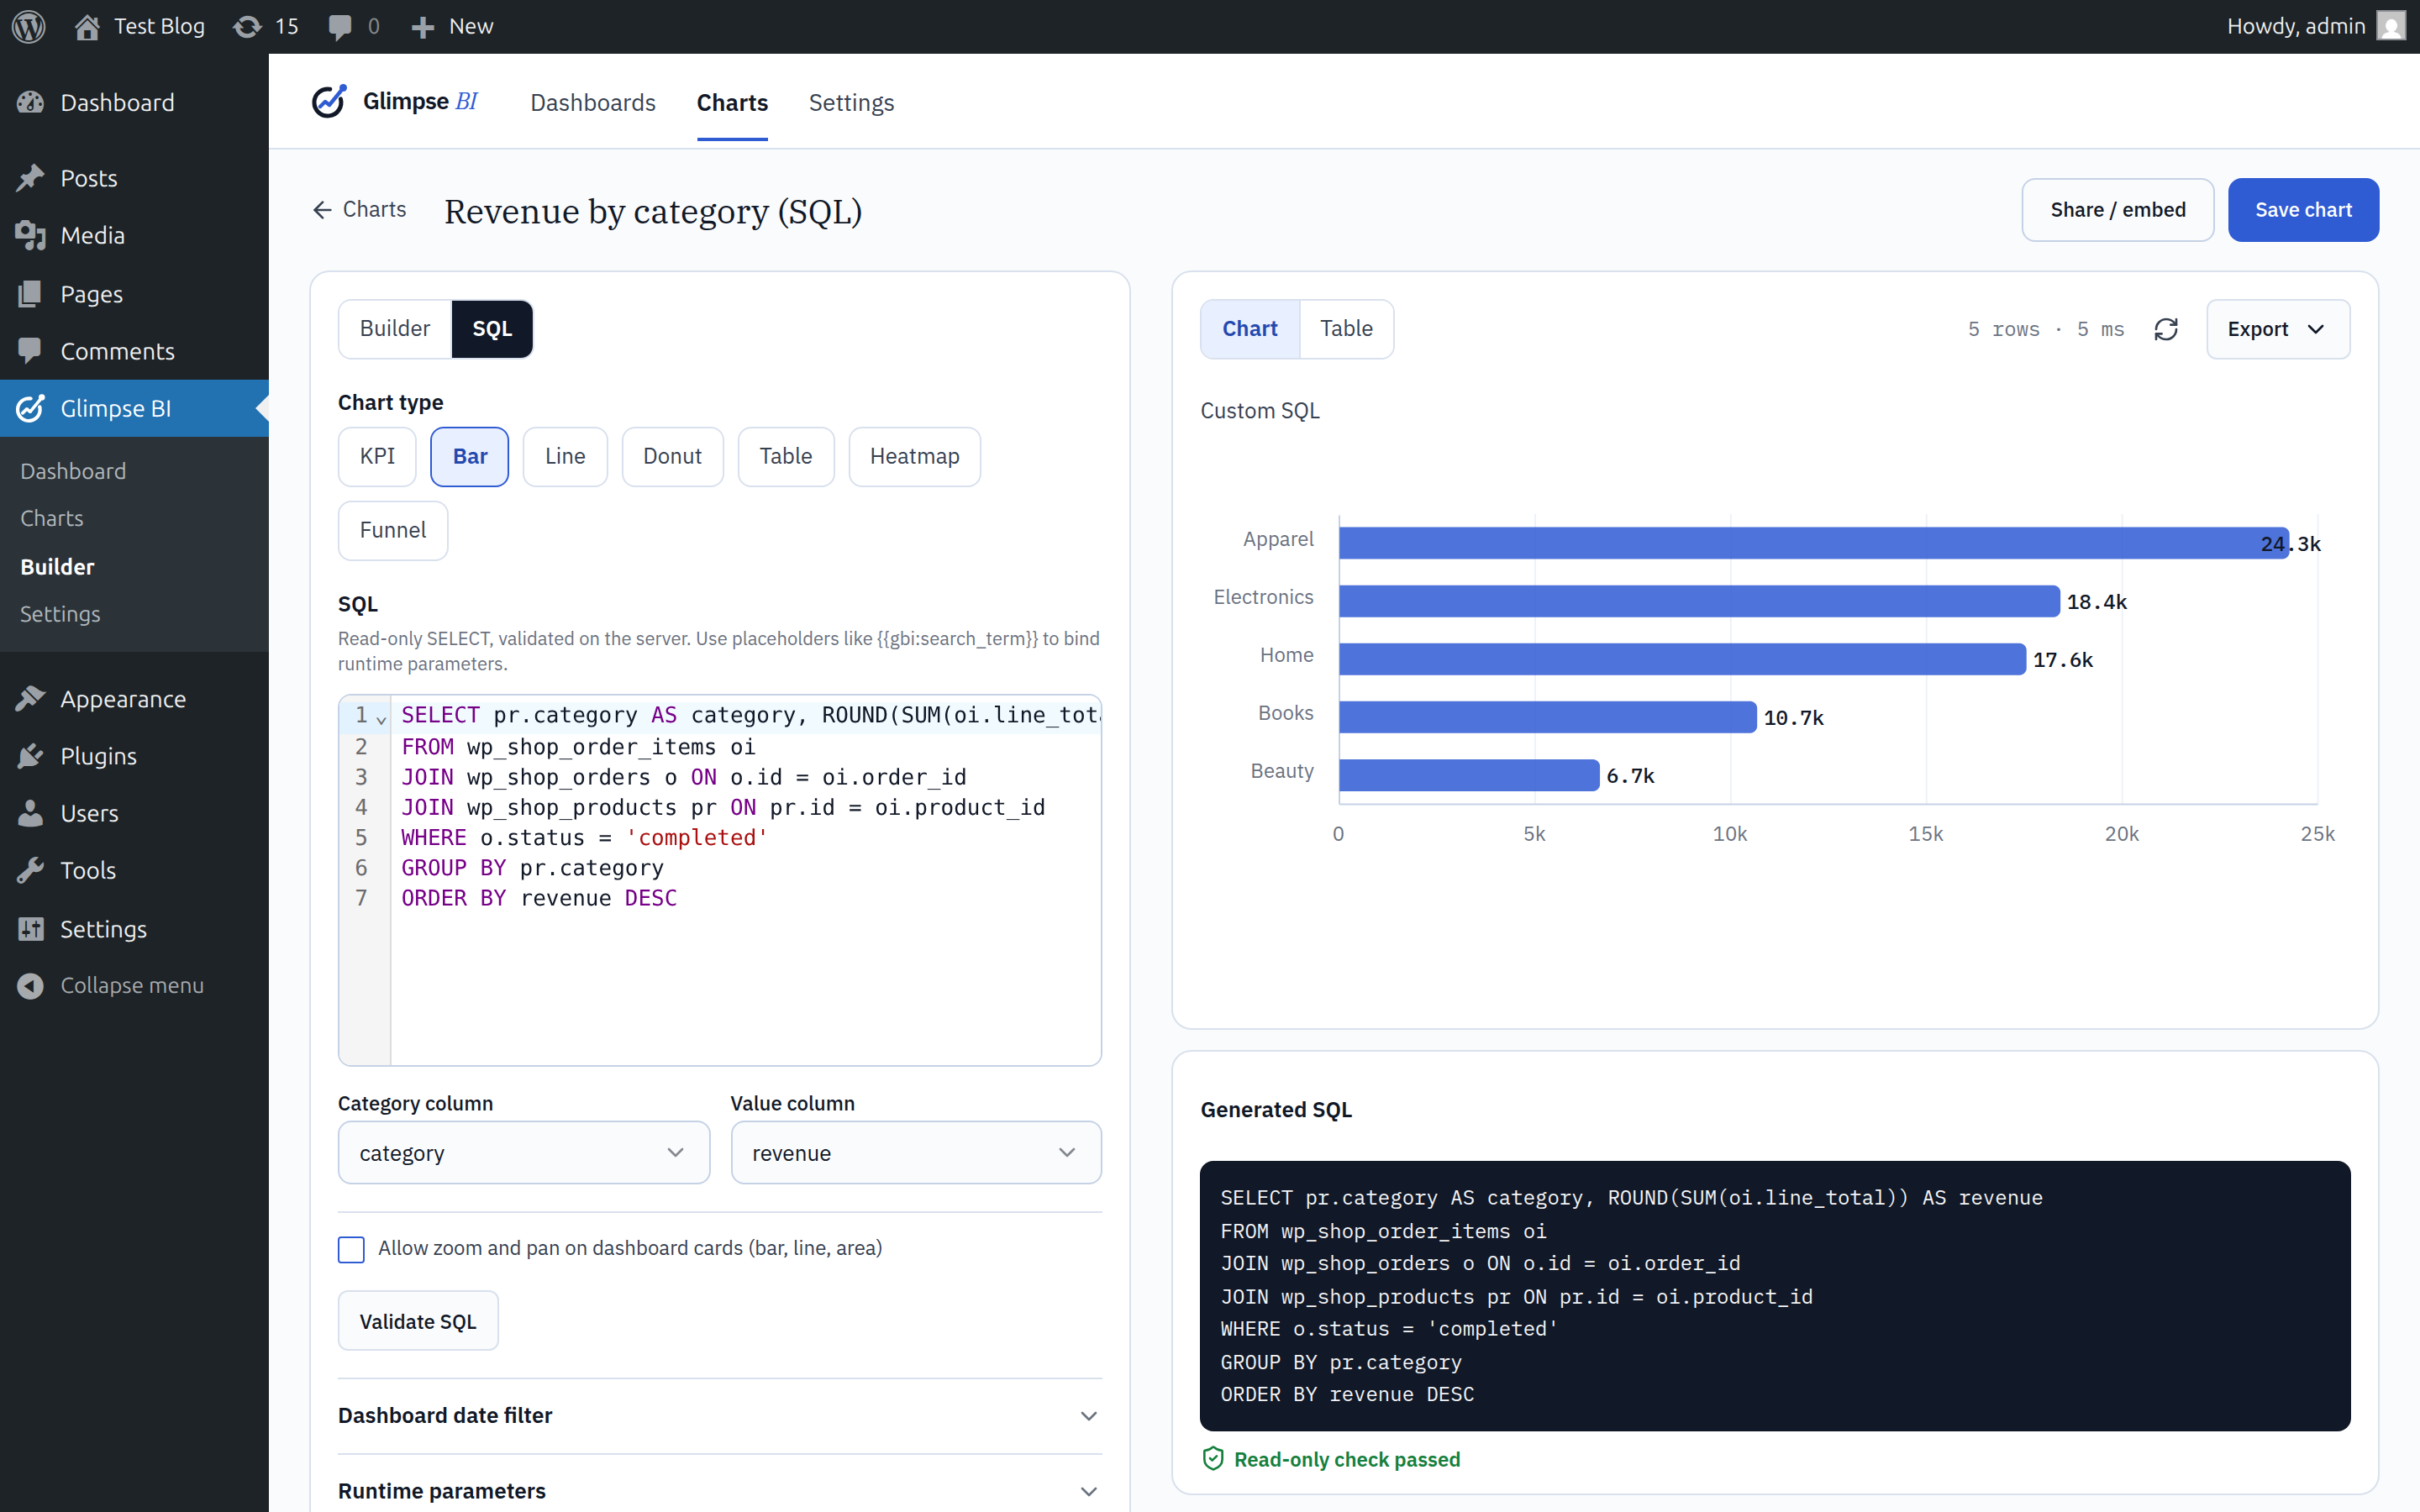
Chart builder, SQL mode — write a read-only query (validated by an AST parser) in a CodeMirror editor with a live preview and column mapping.
Public embed — share a single chart as a token-gated, branded iframe with no wp-admin chrome.

Settings — tune cache TTL, query limits, and schema discovery.