P3 (Plugin Performance Profiler) - Rating, Reviews, Demo & Download


Plugin Description
This plugin creates a profile of your WordPress site’s plugins’ performance by measuring their impact on your site’s load time. Often times, WordPress sites load slowly because of poorly configured plugins or because there are so many of them. By using the P3 plugin, you can narrow down anything causing slowness on your site.
This plugin uses the canvas element for drawing charts and requires requires Firefox, Chrome, Opera, Safari, or IE9 or later. This plugin will not work in IE8 or lower.
Screenshots

First, profile your site. The scanner generates some traffic on your site and monitors your site’s performance on the server, then shows you the results. With this information, you can decide what action to take.
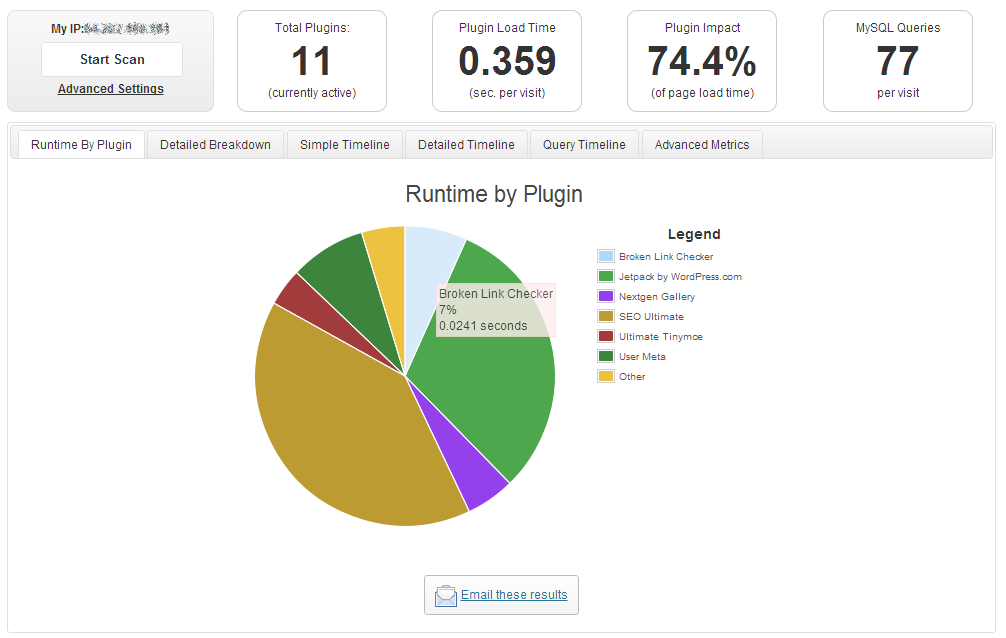
After profiling, you’ll see a breakdown of relative runtime for each plugin.

Callouts at the top give you quick information like how much load time (in seconds) is dedicated to plugins and how many database queries your site is running per page.

The detailed timeline gives you timing information for every plugin, the theme, and the core for every page during the profile. Find out exactly what’s happening on slow loading pages.
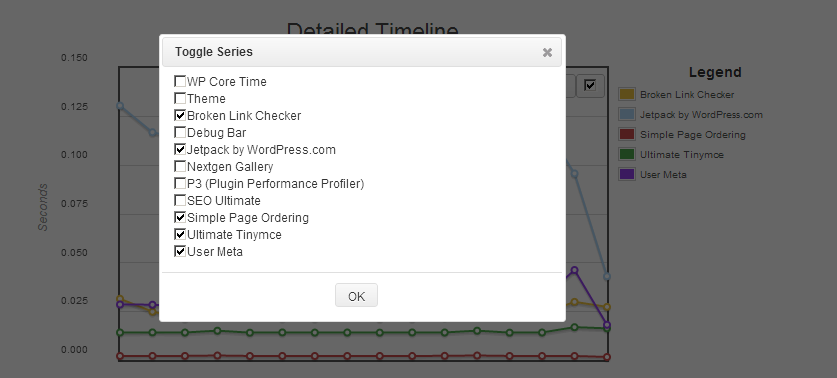
You can toggle each series on and off to customize this timeline for your precise needs.

The query timeline gives you the number of database queries for every page during the profile. Find out which pages generate the most database queries.

Keep a history of your performance scans, compare your current performance with your previous performance.

Full in-app help documentation

Send a summary of your performance profile via e-mail. If you want to show your developer, site admin, hosting support, or a plugin developer what’s going on with your site, this is good way to start the conversation.

Use the advanced settings to activate debug mode, control cache busting, or lock down profiling to a set of IP addresses.

View the debug log on the help page to help troubleshoot if P3 isn’t recording properly.