Simple Charts Wordpress Plugin - Rating, Reviews, Demo & Download
Plugin Description
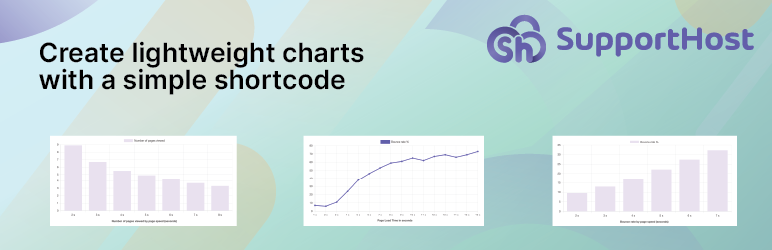
This plugin creates a shortcode you can use to embed charts anywhere inside WordPress. Just add the shortcode, add some options and you are done. You can see it in use on SupportHost website.
It loads only 1 javascript (chart.js) and only loads it on the page where you actually use the shortcode. It’s so lightweight it won’t impact the performances of your website at all.
Charts are created with chart.js, so you can hover them and read the data.
Usage
After the plugin is active, you can just add the shortcode to your pages or posts (or anywhere you can add a shortcode):
[simple_chart type=”bar” name=”mychart” labels=”jan, feb, mar, apr” data=”2,9,3,7″ label=”First series” color=”#00ffff” border=”#000fff” data_1=”7,2,8,1″ label_1=”Second series” color_1=”#000fff” border_1=”#0ff00f”]
Shorcode parameters:
* type: you can decide the type of chart you want ot create. Optional, defaults to line. More on charts types below.
* name: Optional, must be unique per page.
* options: json of chart options as per chart.js docs. Make sure it’s all in one line.
* labels: a list of comma separed labels.
* data: a list of comma separed numbers. You can create data_1 for the second serie, data_2 for the third and so on. Make sure you start from 1, otherwise it won’t work.
* label: The label name for the serie. You can create label_1 for the second serie, label_2 for the third and so on. Optional, if left blank you will see “label_#”
* color: The color user for the serie. If empty will default to the chart.js pink. It is recommended to give each series its own color.
* border: The border color. If empty defaults to the color option.
This is the minimum you can add in the shortcode to make it work:
[simple_chart labels=”Jan, Apr, Mar” data=”2,9,3″ ]
Examples shortcodes:
[simple_chart type=”bar” labels=”2 s, 3 s, 4 s, 5 s, 6 s, 7 s” data=”9.6, 13, 17.1, 22.2, 27.4, 32.3″ label=”Bounce rate %” color=”#e8e1fc” data_1=”3,4,5,1,2,7″ label_1=”Label 1″ color_1=”#ff00ff” options=”indexAxis: ‘y’,plugins: {title: {display: true,text: ‘Bounce rate per load time’, position:’bottom’}}”]
[simple_chart type=”bar” labels=”2 s, 3 s, 4 s, 5 s, 6 s, 7 s” data=”9.6, 13, 17.1, 22.2, 27.4, 32.3″ label=”Bounce rate %” color=”#e8e1fc” options=”plugins: {title: {display: true,text: ‘Bounce rate per load time’, position:’bottom’}}”]
6 Chart types
Supported charts types are:
- Line
- Bar Chart
- Doughnut
- Pie
- Radar
- polarArea
Extremely simple
Just insert the shortcode, add the data and the chart will be shown.
Embed anywhere
If you can use a shortcode in that content you can add the chart.
Screenshots

Create a simple bar chart

Create a simple line chart

Create an horizontal bar chart with multiple data point

Create a bar chart with multiple data point