Turbopress Database Diagnostics Wordpress Plugin - Rating, Reviews, Demo & Download
Plugin Description
Turbopress Database Diagnostics is a diagnostic tool, not a cleaner. It answers a question the usual optimisation plugins do not: why is this installation slow, and which plugin is causing it.
Most sites do not need another delete button. They need to know that 600 KB of options are read and unserialized on every single request, and which plugin put them there.
Autoload with the plugin responsible
Every WordPress request reads all autoloaded options before a single line of the page is rendered. This plugin measures that payload exactly, lists the 25 largest entries, and attributes each one to the plugin that created it.
Attribution works by matching option name prefixes against the plugins installed on the site. It matches strictly: a prefix only counts when the option name continues with a separator, so acf_field_group is attributed to Advanced Custom Fields while acfxtra_setting is not. Anything that cannot be attributed is reported as not attributed rather than assigned to the nearest plausible plugin. Guessing would be worse than saying nothing.
The unattributed remainder is grouped by its shared prefix, so instead of one anonymous lump you see, for example, that six options starting with ionos account for 186 KB. Grouping is not attribution and is labelled as such, but it turns a dead end into something you can search for.
Options whose plugin is no longer installed are reported as their own category. So are theme modifications of themes that have been deleted. These are the leftovers no uninstall routine removed.
Object cache, OPcache and page cache in one picture
- Detects whether a persistent object cache is active and which backend serves it: Redis, Valkey, Memcached or APCu. Where none is active, the report states what is actually known: that the PHP extension is loaded means the client side is ready, not that a cache server exists. On shared hosting the extension is usually compiled in for every account while the server runs per account, or not at all, and the plugin does not pretend to know which.
- Reads Redis and Valkey statistics through the connection the drop-in already holds. The plugin never opens its own connection and never asks for host, port or credentials. Reported are hit rate, memory use, fragmentation ratio, evicted keys and the
maxmemory-policy. - Reads the origin of the
object-cache.phpandadvanced-cache.phpdrop-ins from their file header. - Warns when two plugins are doing the same caching job. A page cache beside an object cache is the normal arrangement and is not reported as a conflict.
- Reports OPcache memory, utilisation, hit rate and wasted memory, and tells apart the states that look identical from the outside: not installed, switched off, running but with
opcache_get_statusindisable_functions, running but withopcache.restrict_apilocking this path out, and measured from the command line where OPcache is off anyway. Only the first two are faults of the site; the rest are hosting arrangements and are left out of the score rather than counted against you. Where the counters are unreadable the plugin still asksopcache_is_script_cachedwhether a WordPress core file is in the cache, so it can say whether OPcache is actually working instead of guessing from a configuration flag. - Identifies a page cache from the response headers of a loopback request to your own home URL, and tells a cache that answered from one that was merely present and did not serve. When a cache did answer, a second request with a cache busting parameter measures how long the same page takes when no cache can answer it. That turns “your site would be slow without its page cache” from an assertion into a number. Both requests can be switched off in the settings.
In the Site Health screen
Three findings are also placed in Tools Site Health, where people already look: the autoload payload, what removed plugins left behind, and orphaned metadata. Only those three, and only because WordPress does not check them itself; its own object cache and cron tests are not repeated. Site Health never triggers a scan, it reads the last one.
What changed since last time
Each measurement is recorded, thirty of them, in an option that is not autoloaded. The report then says what moved: “+180 KB since the measurement three days ago”. That answers the question a single snapshot cannot, which is since when, and knowing what you installed that week usually names the cause.
It also checks whether the options table has the index on the autoload column that WordPress 6.6 introduced. An installation that grew out of an older version sometimes lacks it, and without it the first query of every request scans the whole table.
The verdict
From these measurements the plugin names the one factor that costs the most time before the first byte, in plain language and with the numbers it is based on.
It also states the interaction administrators most often get wrong: a persistent object cache removes the database query for your options, but not what follows it. The decoded options are held in memory for the whole request, on every request, cache or no cache.
The plugin measures both halves of that cost on your server rather than asserting them. On a 590 KB payload the decoding itself took 0.9 ms, which is not worth worrying about, while the decoded result occupied 2.0 MB of memory, three and a half times its size on disk. That is the number that matters on a host with a tight memory limit, and it is the reason a large autoload payload hurts.
Scheduled events
WordPress has no scheduler of its own; it keeps the list of due work in a single autoloaded option and looks at it when someone visits. The plugin reads that list and reports three things that go wrong with it: an event scheduled hundreds of times over because a plugin rescheduled without unscheduling first, events overdue by days because nothing is triggering cron at all, and events belonging to plugins that are long gone. Every hook is attributed to its plugin the same way options are.
Database bloat
Orphaned post, term, comment and user meta, post revisions, expired transients, auto-drafts and trashed posts. A table overview from INFORMATION_SCHEMA with size, engine, row count, collation and free space. Tables whose prefix belongs to a plugin that is not installed.
Free space is reported per engine rather than as one number, because DATA_FREE does not mean the same thing everywhere. In MyISAM it is waste that OPTIMIZE TABLE returns to the file system. In InnoDB it is space the engine reuses for new rows, so it is reported separately and never called reclaimable. And with innodb_file_per_table switched off it describes the shared tablespace, so the same figure appears on every table; there the plugin leaves it out and says why, rather than adding one number up thirty times.
Collations are compared against the WordPress tables, not against the majority: on a site with many plugin tables the plugins outnumber core, and a plain majority would report WordPress itself as the anomaly. Tables still on the three byte utf8 or utf8mb3 are called out separately, because those cannot store emoji and make joins against utf8mb4 tables fail outright.
On large tables the exact count is attempted under a deadline enforced by the database server. Only when that deadline passes does the plugin fall back to a bounded sample, and the result then says so. Because orphans are created by events and therefore sit in contiguous blocks rather than spread evenly, a sample can be genuinely inconclusive; in that case the plugin reports a confirmed lower bound and states that the total could not be determined, instead of printing a number that looks measured.
WooCommerce data is treated with care. Orders, their metadata and active sessions are never counted as orphaned, trashed orders are never offered for deletion, and while WooCommerce keeps its orders in its own tables (HPOS), post meta is reported but not offered for cleanup at all: whether a row still belongs to an order cannot be answered reliably then, and that is not a basis for an irreversible delete.
Cleanup
Cleanup exists, but it is a side function, not the selling point. Every category runs on its own, never all at once. Dry run is the default: you see how many rows are affected and confirm before anything is deleted. Work is batched over the REST API with a progress display. There is no cron job and no automatic cleanup.
On the command line
Everything the screen does is available through WP-CLI, because the scanners
were written to know nothing about the admin screen.
wp turbopress-diagnostics scan                    # score and the figures behind it
wp turbopress-diagnostics scan --refresh          # measure again first
wp turbopress-diagnostics report > report.json    # the full document
wp turbopress-diagnostics categories              # what can be cleaned, and how much
wp turbopress-diagnostics cleanup orphan_postmeta            # simulate
wp turbopress-diagnostics cleanup orphan_postmeta --execute  # delete, asks first
That turns a report across many installations into a shell loop, which is the
difference between a tool for one site and a tool for a hosting account.
What this plugin does not do
- No upsell, no pro version, no locked features. What you install is the complete plugin.
- No advertising and no external links in the interface.
- No telemetry, no tracking, no phoning home.
- No external HTTP requests, with one exception: the optional loopback requests to your own home URL that detect a page cache and measure the uncached response time. They can be switched off in the settings.
Screenshots
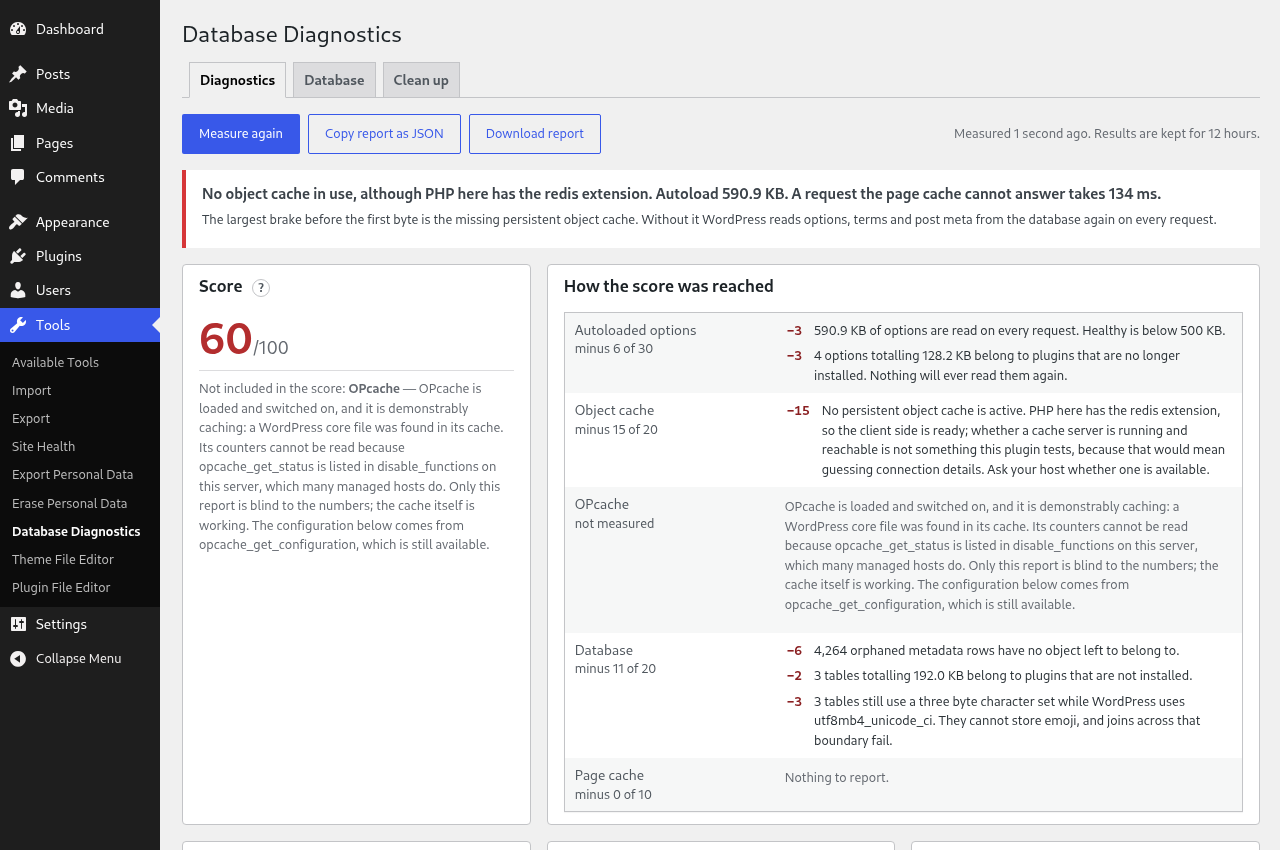
The diagnostics tab: the score, the plain sentences behind it, and every deduction listed with the finding that caused it.
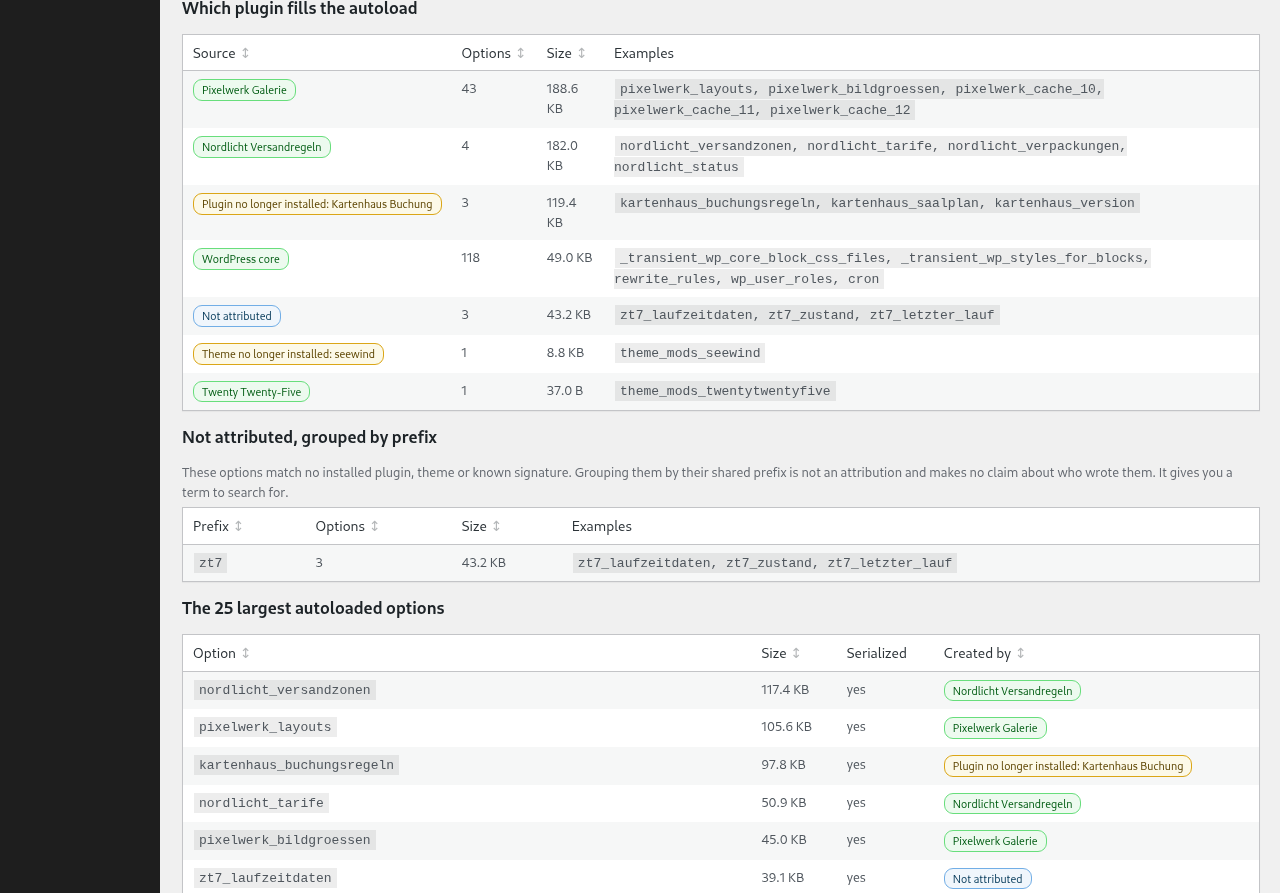
Autoloaded options attributed to the plugin that created them, with the unattributed remainder grouped by prefix.
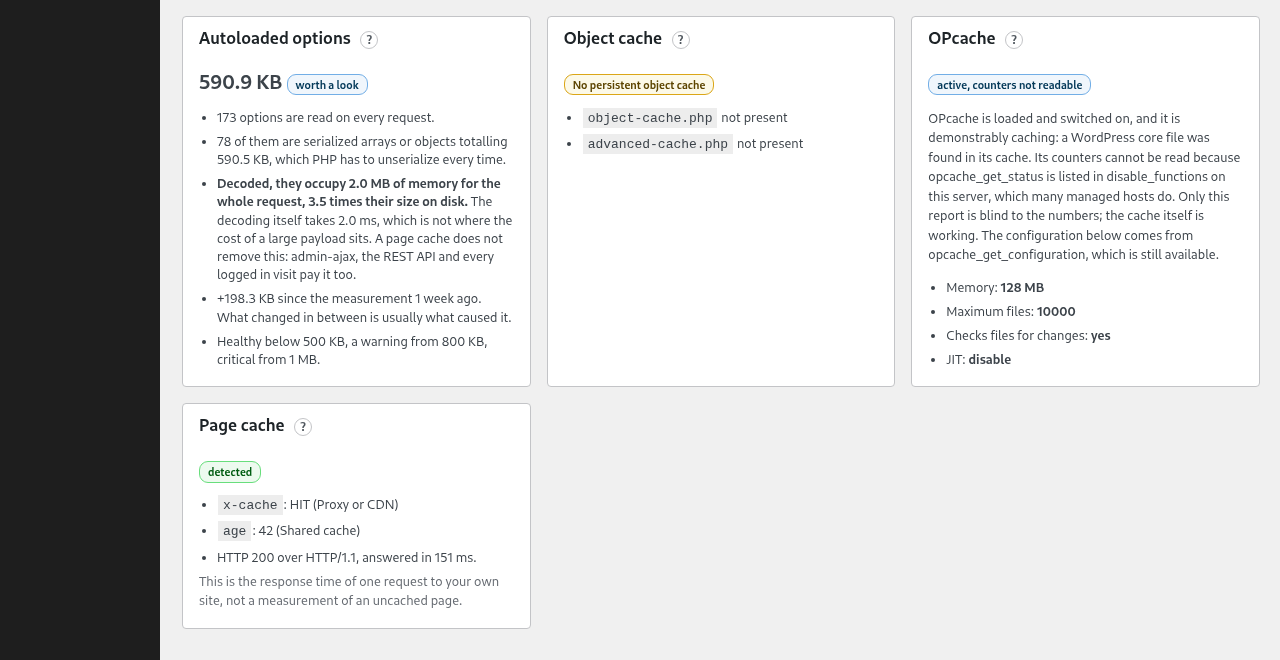
Autoload, object cache, OPcache and page cache side by side, each with the figures it was judged on.
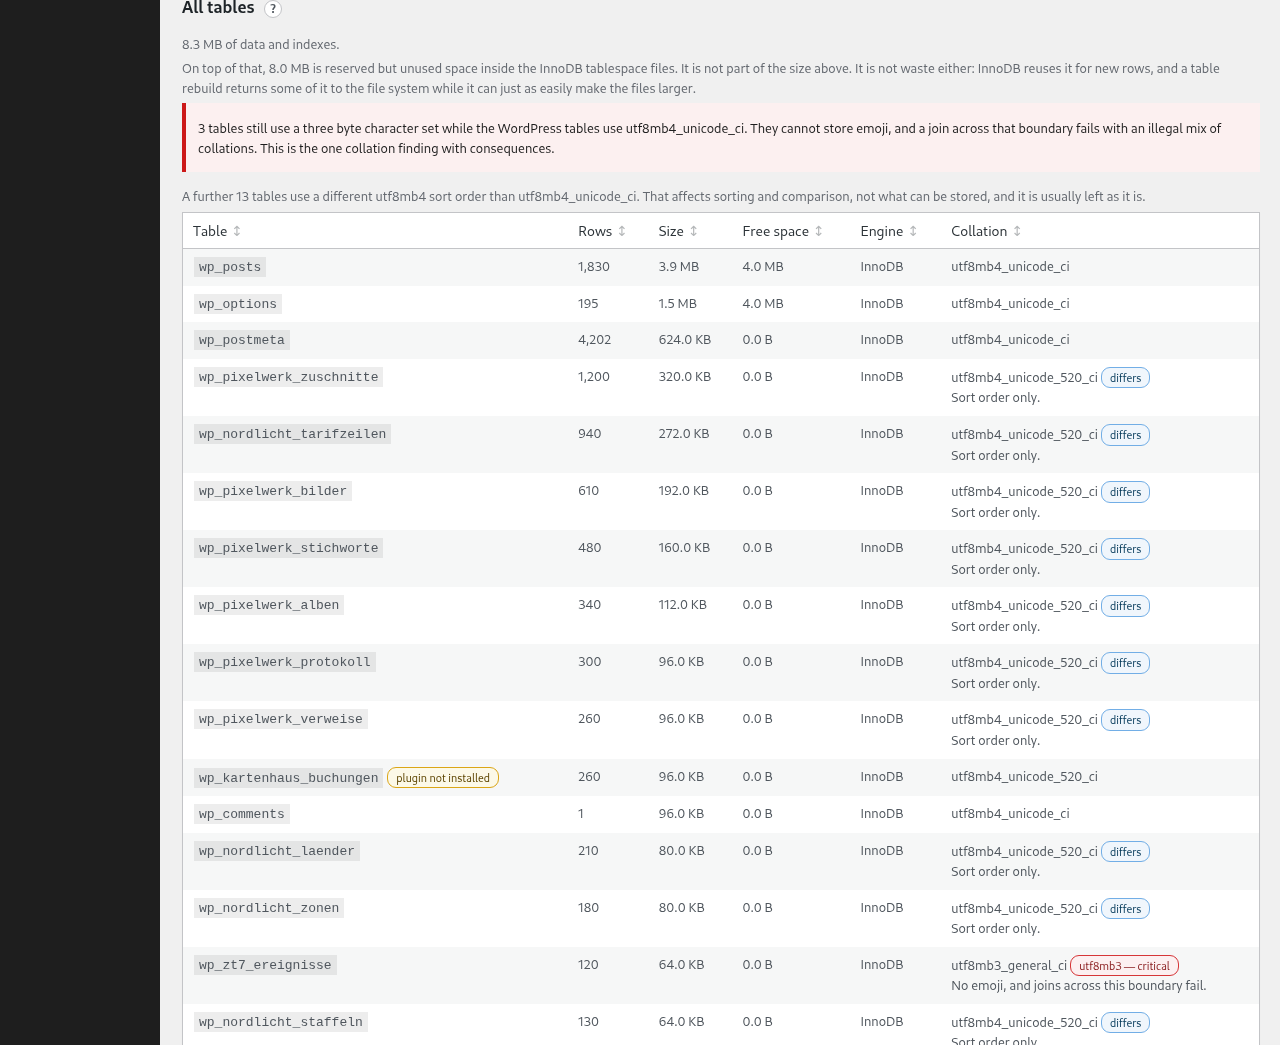
The table overview: sizes, free space and collation differences, with the mixes that break joins marked as critical.
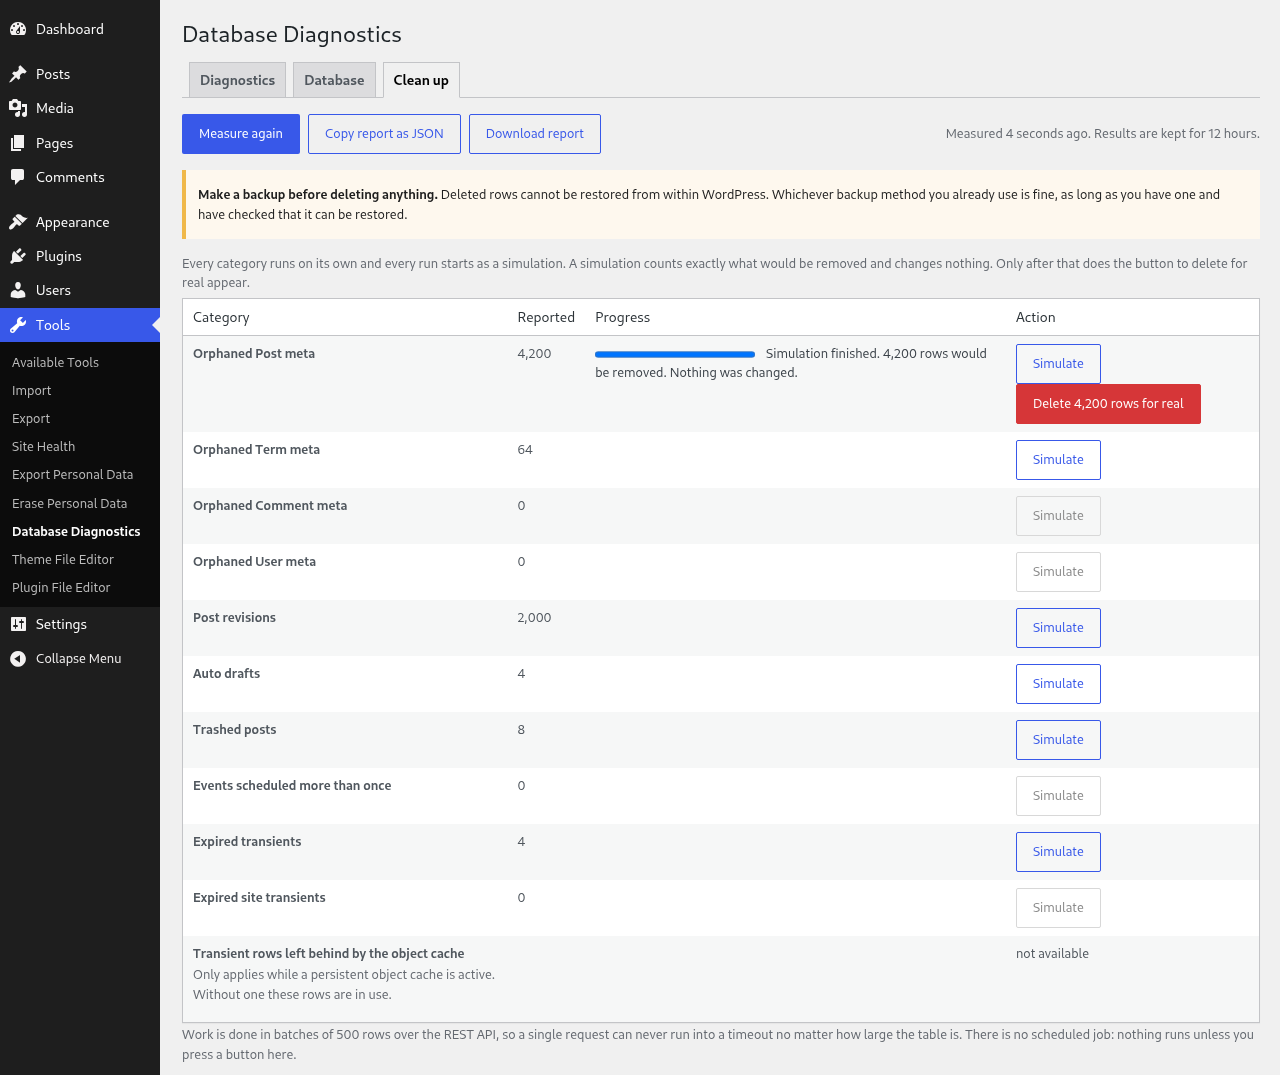
Cleanup after a dry run: the rows were counted, nothing was changed, and only now does the button to delete for real appear.