WooCommerce Interactive Reporting By ZoomCharts Wordpress Plugin - Rating, Reviews, Demo & Download

Plugin Description
WooCommerce Interactive Reporting by ZoomCharts
Interactive drill-down sales data report for day-to-day sales monitoring and management
Compatible also with WooCommerce 3.0.x
Current plugin version: 0.0.4
In short:
- No setup or customization is needed – just install and activate plugin.
- To access plugin, you will find a menu item called “WooCommerce Reporting” in administration side menu or under WooCommerce submenu an item called “Iteractive Report”. Both links lead to the same resource.
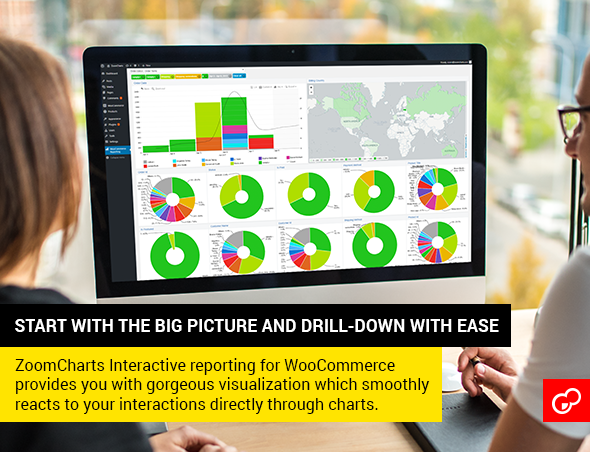
- Plugin collects all your WooCommerce order data and automatically categorizes them into charts.
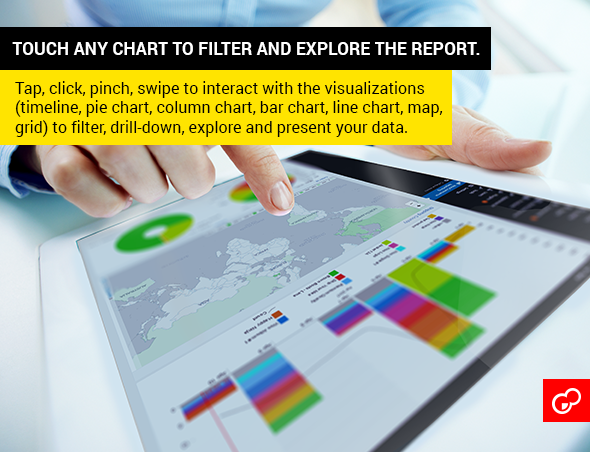
- Click on pie chart slices or click on time chart bars to filter out your desired results. Also you can select countries on the map to filter results geographically.
Interaction with the charts happens in the most natural way – with a simple touch, pinch or swipe.

Key benefits
- ZoomCharts provides instant and easy-to-use interactive sales data report for stores of all sizes.
- Interactive report is generated automatically – no need to spend time on configurations and setup.
- Great for visualizing, exploring and presenting the sales data in daily and weekly sales meetings.
- Ability to quickly filter data by product, customer, status, currency, payment method, shipping and billing coutries, shipping method and other fields. It displays taxes, refunds, discounts, and totals.
- Switch between orders and order items to see the trends and important details:
Orders – displays only order information without going into item details.
Order Items – multiplies list to display all order items in addition to order information. - User friendly interface – filter data by touching the necessary column, slice or country – use mouse or touch to focus on what’s important.
- Full-text search for instant filtering.
- Enterprise level email and forum support.
-
Explore your sales data though interactive report
-
Visualize, analyze and profile your customers
-
Keep track of your sales and stay up-to-date

Other features:
Fully responsive
Use the interactive reports on your desktop, mobile phone and tablet – as long as you have access to Shopify admin interface, you can use the interactive reports.
Fully interactive
Filter data directly through the visualizations. Tap (click) timeline to select time. Pinch on the timeline to fine-tune the selected time period. Tap on the pie charts to filter data by category.
Full-text search
Use the search option to filter the data as you type. The report will instantly show the matching sales data.
Fully Automated
Interactive report is generated dynamically based on your data – no need to spend countless hours to configure and setup.
Automatic slice grouping into others and previous slices
ZoomCharts provides automatic slice grouping mechanism which is useful in scenarios where there are many slices in one level. Tap on “Others” to explore what it consists of. Click on “Previous” to return to previous set of slices.
Eye-catching animations
Data exploration is complemented with fluid animations making transitions between different states eye-catching and engaging.

Cross-device cross-platform compatible
As ZoomCharts charts uses pure JavaScript for visualization and interactivity, they are compatible with all contemporary computing devices that have internet browser with Canvas support. Current browser support is as follows:
- Internet Explorer 9.0+
- Firefox 3.5+
- Chrome 4.0+
- Safari 4.0+
- Opera 10.5+
- iOS 3.2+
- Android 2.1+
Why ZoomCharts?
ZoomCharts is being used in more than 35 countries world-wide with customers across all-size companies from many industries.
ZoomCharts develops interactive charts and graphs for web, mobile and desktop applications. The main competitive advantage of ZoomCharts charts is its interactivity.
With ZoomCharts end-users can drill-down into different aspects of data, scroll, zoom-in and zoom-out using natural touch and multi-touch gestures.
ZoomCharts is the next big leap in the world of charts and graphs. ZoomCharts is challenging the very concept of charts by enabling the transition from static data representation to a fully interactive and dynamic user experience. Essentially, charts become alive. Think of a picture vs a movie.
Change log
0.0.4 – 2017-04-24
- Some textual changes.
- Column ‘Is Currently Featured’ fixed for ‘order items’ view.
- Column ‘Is Downloadable’ added for ‘order items’ view.
- Column ‘Product Type’ added for ‘order items’ view.
- PHP memory limit changed for large amount of orders to be processed.
- Support for case if product is deleted from database.
0.0.3 – 2017-04-15
- Removed unnecessary code.
- Cleanup.


