WP Flot Wordpress Plugin - Rating, Reviews, Demo & Download

Plugin Description
This plugin adds shortcodes for line, pie and bar charts, created with the Flot javascript library.
For more information on Flot see their website.
Usage
Use the [linechart], [piechart] or [barchart] shortcodes, with the data enclosed between the tags (see example). You can further change the appearance of your chart by using a number of attributes, a full list of which can be seen here. If you have the Shortcake plugin enabled, you can add the charts using the ‘Add Media’ button.
The javascript file is not loaded on all pages to reduce pageload, but will be automatically added to all pages using the shortcodes after it has been loaded once. Alternatively, you can set a custom field ‘flot’ to ‘yes’.
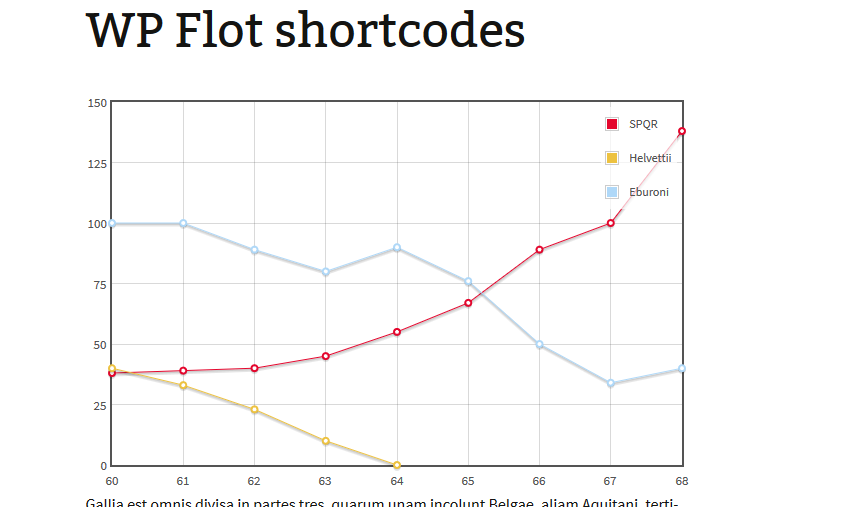
Linechart example:
[linechart minx="1950" maxx="1965" miny="0" maxy="100" steps="false" fill="true" points="false" legend="true"]
           { label: "Series 1",
        data:   [[1963, 43],
                [1959, 48],
                [1956, 50],
                [1952, 30]]
},
    {
        label: "Series 2",
        data:
            [[1952, 30],
            [1956, 49],
            [1959, 49],
            [1963, 50]] }
[/linechart]
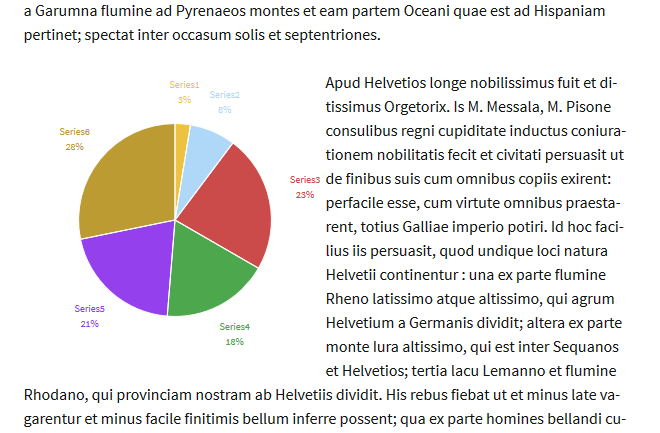
Pie chart example:
[piechart donut=”0.5″]
{ label: “Series1”, data: 10},
{ label: “Series2”, data: 30},
{ label: “Series3”, data: 90},
{ label: “Series4”, data: 70},
{ label: “Series5”, data: 80},
{ label: “Series6”, data: 110}
[/piechart]
Bar chart example:
[barchart]
{ label: “Bars”,
data: [[1, 6],[2, 4],[3, 5],[4, 6],[5, 14],[6, 5],[7, 12]] },
{ label: “More bars”,
data: [[1.5, 3],[2.5, 3],[3.5, 15],[4.5, 3],[5.5, 10],[6.5, 11],[7.5, 10]] }
[/barchart]
Please note that in Flot, a bar chart reacts like a line chart. If you have two data series with similar positions on the x-axis, they will overlap instead of showing side by side. Also, you need both values to be a number, no text.
Screenshots

Line chart made with WP Flot.

By putting the shortcode inside a div set to float, you can have your posts flow around the charts.


