WP Tools Increase Maximum Limits, Repair, Server PHP Info, Javascript Errors, File Permissions, Transients, Error Log Wordpress Plugin - Rating, Reviews, Demo & Download

Plugin Description
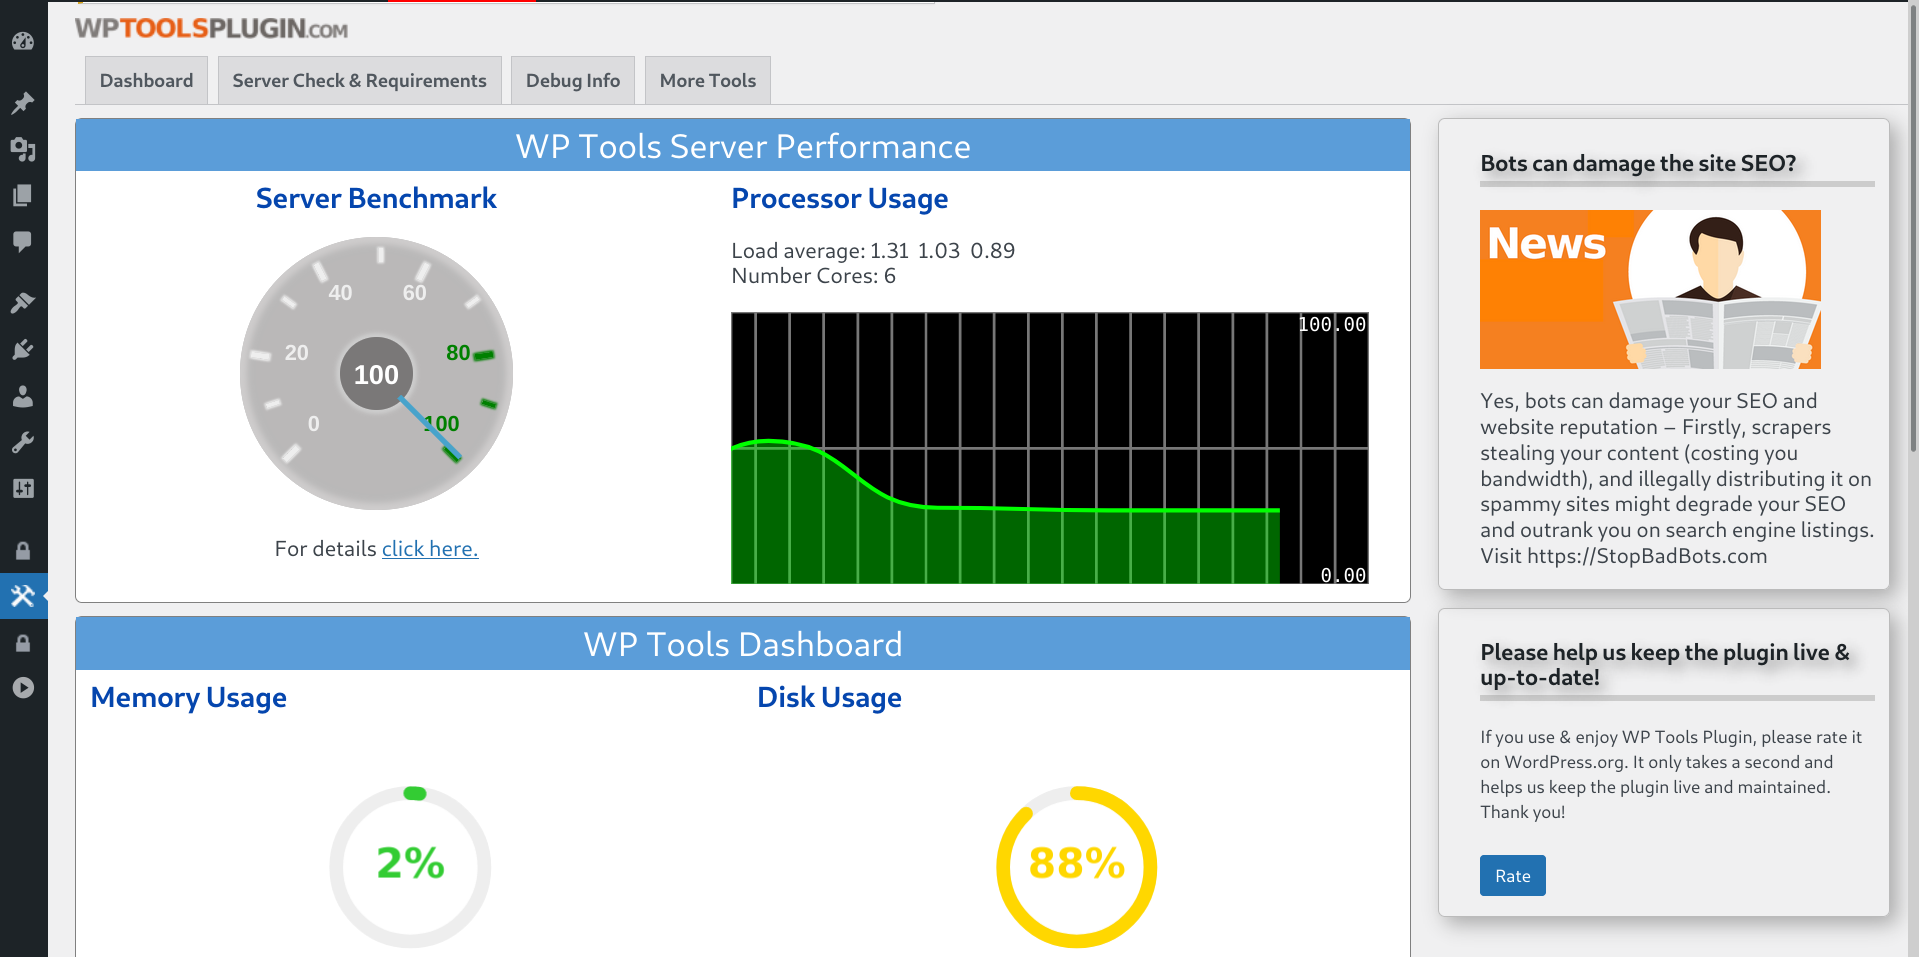
The WP Tools plugin (wp-tools) features a comprehensive dashboard showcasing server statistics, including a chart of errors, page load time also by page and boasts over 49 tools designed to simplify your WordPress management tasks. It serves as a versatile Swiss army knife for your WordPress needs.
Catch and alert about Javascript Errors (and also PHP/MYSQL errors). Block notification email of updates, Hide Admin Bar, Disable Lazy Load, Displays the folders that are taking up more disk space and a lot more…
Translation ready. Files included: Dutch, English, French, Italian, Portuguese, Spanish, and German.
A must have plugin also by cloud hosting as AWS Amazon Lightsail, EC2 instance, Bitnami, Contabo, Azure, Google Cloud, Digital Ocean and others.
- Increase the PHP memory limit, Increase Maximum Execution Time limit, and Increase maximum upload file size limit without editing any WordPress or PHP files.
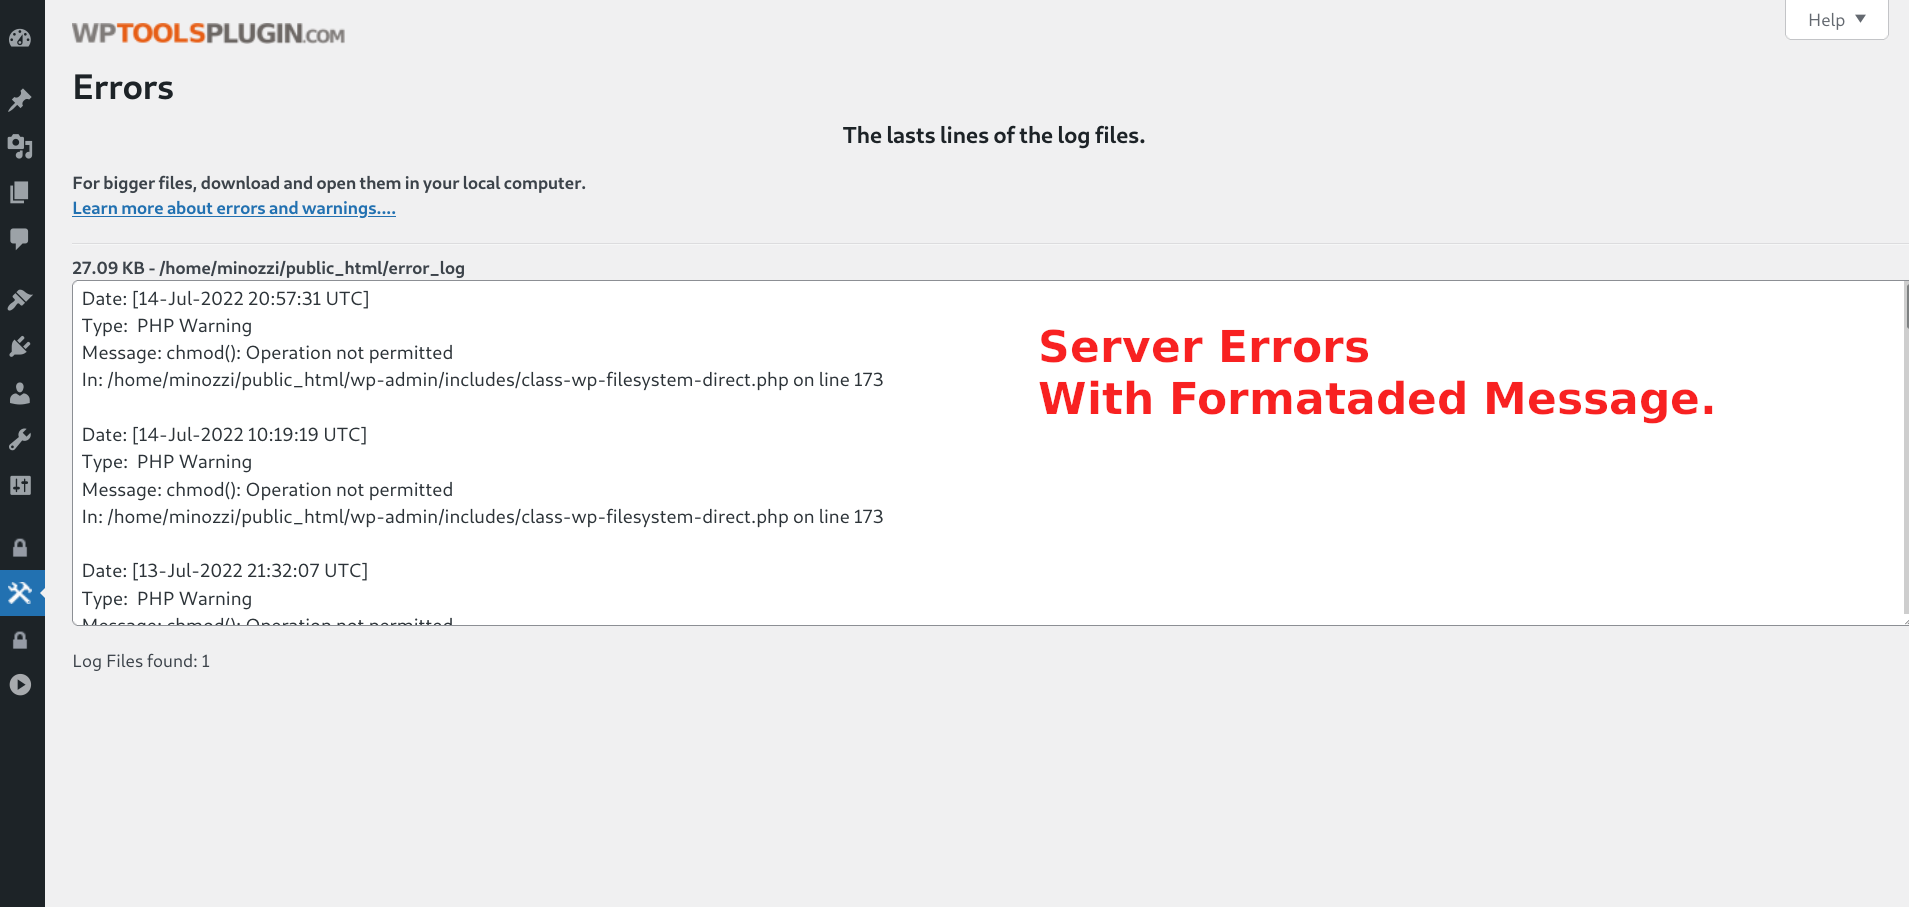
- Show the WordPress errors (PHP errors error_log, error log or error reporting), limited to 200 last WordPress errors to Help you fix issues.
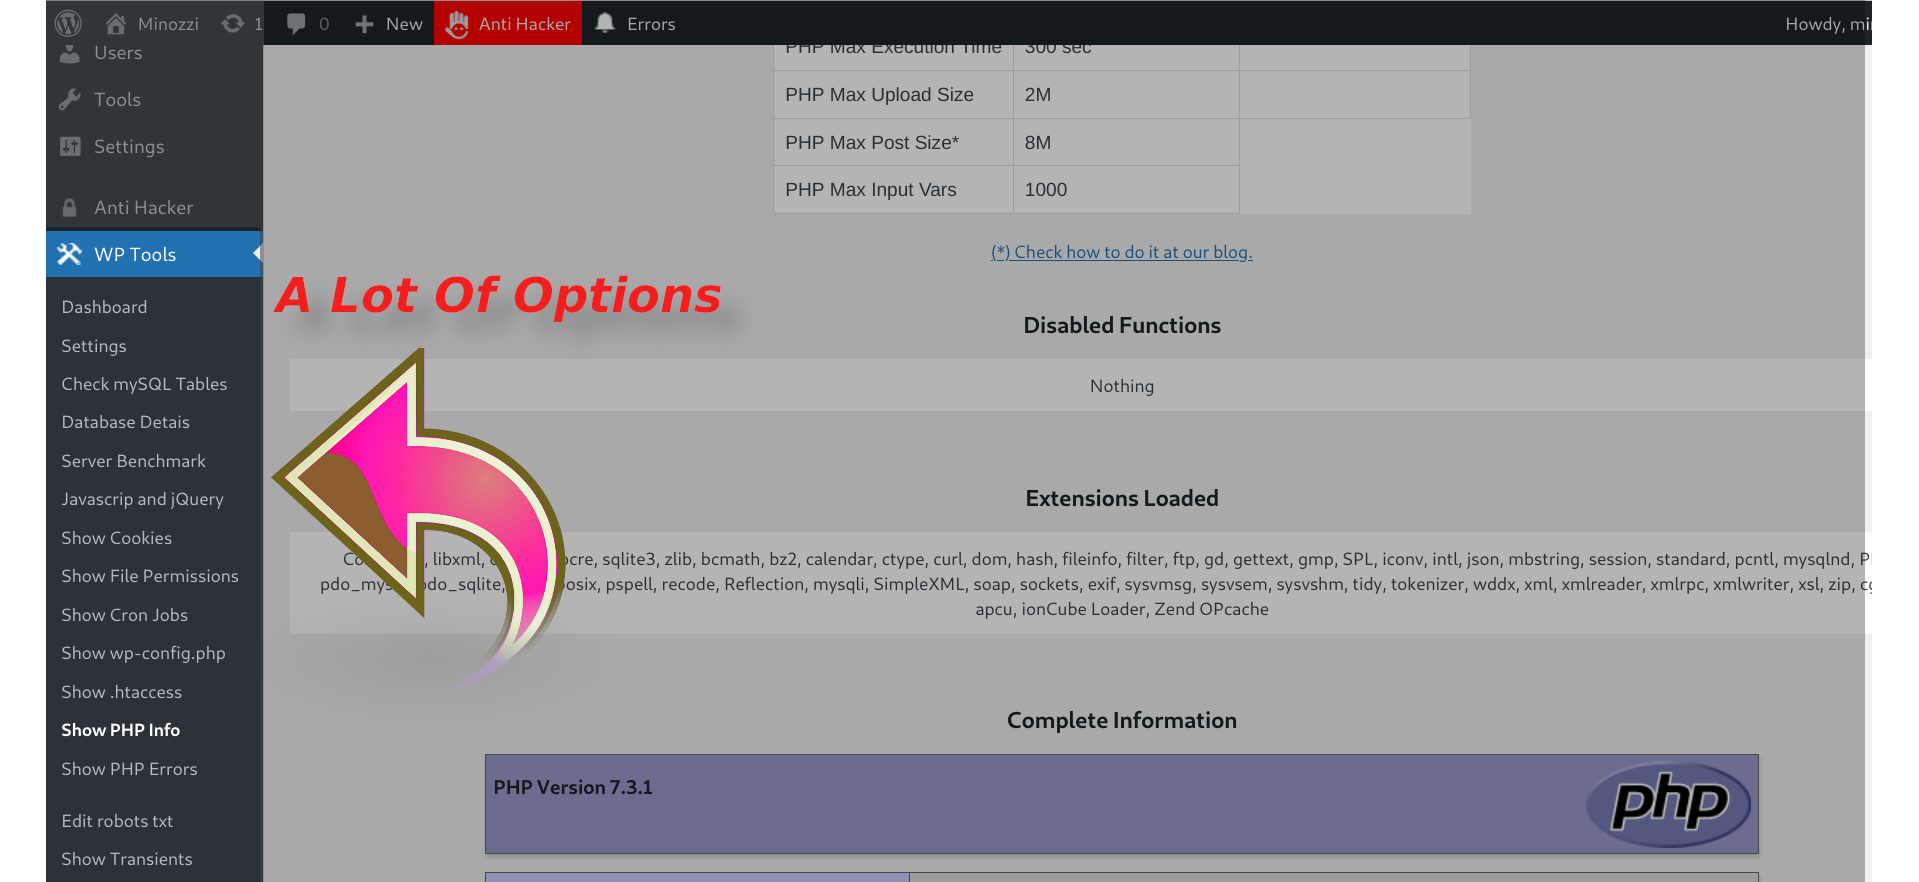
- Show the PHPINFO with a lot of info about your PHP server configuration, also server IP.
- Disable WordPress Native Sitemap Automatic Creation or only user’s sitemap.
- Disables the default notification email sent by a site after an automatic core, theme or plugin update.
- Add Google Search Central HTML TAG.
- Add Google Analytics GA4 Tracking ID.
- Alert on Top Admin Bar if WordPress Debug is active.
- Hide Admin Bar from non Administrators.
- Deactivate Lazy Load functionality.
- Deactivate Emojis functionality.
- Page Load Info: Number of SQL queries per page and page load time.
- Record and send email notifications when PHP notices, warnings and errors happen.
- Show and edit the file robots.txt.
- Show and check MySQL tables and database usage and MySQL details.
- Bypass WordPress debug and show errors and warnings on screen.
- Show Cron Jobs table and delete Cron Jobs without functionality.
- Show file .htaccess.
- Show file wp-config.php.
- Show Cookies.
- Restores the previous classic widgets settings UI screens and disables the gutenberg block editor from managing widgets.
- Disable the WP Admin Bar / Toolbar on the frontend of sites.
- Show Button with WordPress Errors on Admin Toolbar.
- Show Files and Folders Permissions.
- Show Table only with Javascript errors and jQuery Version.
- Replace WordPress logo at login screen.
- Remove WordPress icon from the admin bar.
- Erase readme.html and license.txt files at root folder.
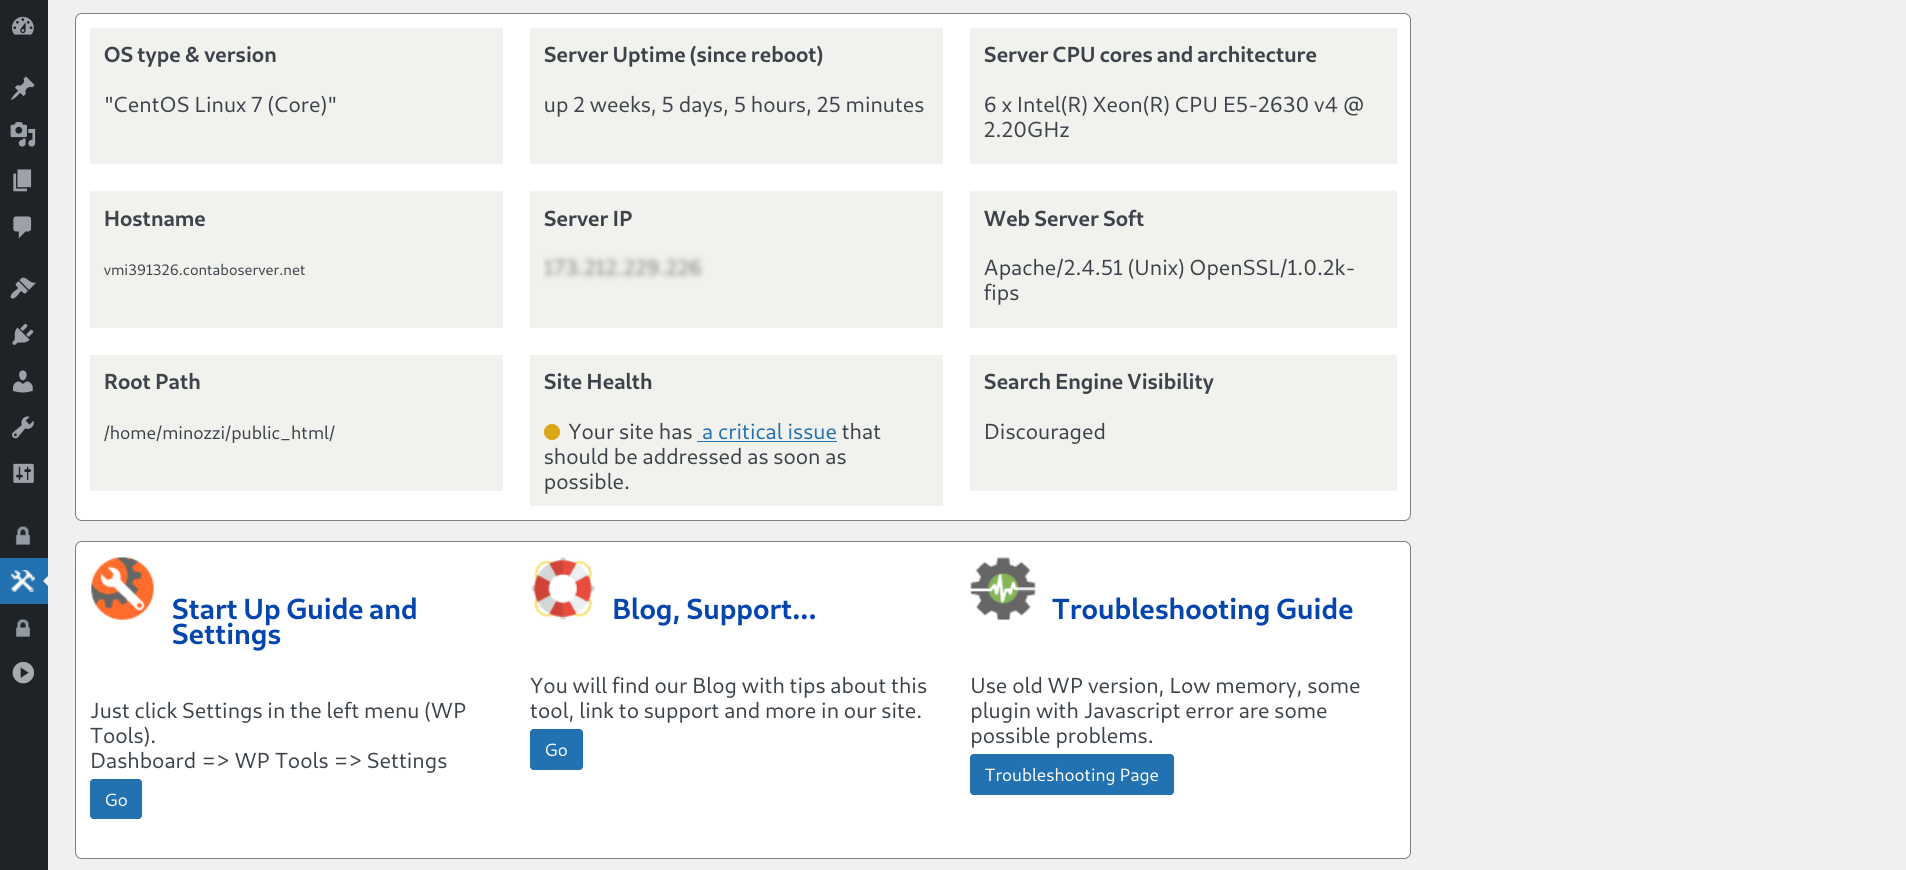
- Show disk total space, disk used and disk free.
- Show Server Benchmark Server Check-Up or Server Checkup.
- Show MySQL Info and database information.
- Disable javascript console log for non administrators.
- Show and check file permissions.
- Enables the WordPress database tools to optimize and repair InnoDB and MyISAM database tables.
- Show and delete Transients.
- Disable Self PingBack.
- Show Search Engine Visibility WordPress Setup.
- Show Server Root Path.
- Site Health Alert.
- Show PHP Extensions Loaded.
- Show PHP Disabled Functions.
- Show MYSQL Table Prefix.
- Show Database charset.
- Show Robots.txt.
- Erase file .maintenance.
- Improve Dashboard Performance by prevent WordPress from fetching news and Clean up WordPress admin dashboard.
- Resolve ‘Incompatible Archive’ issue when installing plugins from zip files by using PclZip instead of ZipArchive. Consider using this option only for new plugin installations.
- Show Server Load Average percentage for the last minute at top admin bar. **
- Show MU Plugins (Must-Use Plugins or Must Use Plugins)
With the last tool, now you can monitor your server load (CPU Usage), in real time, from your wordpress admin panel.
Requirements for use Show Server Load Tool and Dashboard
- Linux Server (not Windows server)
- shell_exec enabled on your PHP (ask for your hosting to enable it if necessary)
- Server Files Readable: /proc/cpuinfo and /proc/stat
- php functions enabled: sys_getloadavg(), disk_total_space(), disk_free_space()
Lifetime license with premium enhancements: One-time payment of just $17.99!
PHP INFO DETAILS
On PHP INFO page, you can get, for example:
- Display PHP Version
- Operating System details
- PHP.INI path (Configuration File (php.ini) Path )
- Log Errors on or off
- FTP (FTP Support)
- GD
- MySql and MySqli version
- Session
- Soap
- XML
- ZIP
- ZLIB
- Timezone
- Cookies
- Modules
- PHP Variables
- Post Max Size (Post Max Size, Post Maximum Size)
- max_execution_time (set_time_limit, max execution time, (maximum execution time exceeded))
- max_file_uploads, upload_max_filesize (max file uploads, maximum file uploads)
- max_input_nesting_level (max input nesting level)
- max_input_time (max input time, maximum input time)
- max_input_vars (max input vars, maximum input vars)
- memory_limit (Memory Limit)
- smtp_port (smtp port)
- A lot more …
mySQL info
On database details page, you can get, for example:
- MySQL (or Maria Database) version
- Database size (Database Usage)
- Index size (Index Disk Usage)
- max_allowed_packet (max allowed packet, maximum allowed packet)
- default_storage_engine (default storage engine)
- max_connections (max_connections, maximum connections)
- max_user_connections (max user connections, maximum user connections)
- thread_cache_size (thread cache size)
- query_cache_type (query cache type)
- query_cache_size (query cache size)
- sort_buffer_size (sort buffer size)
- read_buffer_size (read buffer size)
- port (mysql Port)
- tmp_table_size (tmp table size)
- read_rnd_buffer_size (read rnd buffer size)
- join_buffer_size (join buffer size)
- table_definition_cache (table definition cache)
- table_open_cache (table open cache)
- character_set_system (character set system)
- default_storage_engine (default storage engine)
- A lot more …
Multisite
Not tested on Multisite.
3rd party as a service
The WP Tools plugin offers an a optional free Community Server Performance service.
To participate, you must enable the feature within the plugin by checking
the box labeled “Participate in Community Server Performance.” on plugin Settings page.
Enabling this feature allows your site to share only server performance data with the WP Tools Plugin.
In return, your WordPress site receives updated aggregated industry average data.
The data collect are:
Time
PHP and MYSQL Version
Platform is Linux?
Server ip address
Benchmark (only time): Math, String, Loops, Conditionals
MYSQL (only time): Connect, Select DB, Query Version, Benchmark
We will create an aggregated industry average data and let you see in your dashboard.
The WPTools plugin will retrieve tips and news from our site BillMinozzi.com. This information will be displayed in the plugin dashboard, in the right-hand column under the title “Tips and News.” No data is sent to our server.
These are the terms of use for our plugins.
To learn more details about the wptools plugin, visit the plugin site.
External service
When using our chat, only some information about issues, such as your language and data from the Diagnose tab, may be sent to our server. We do not share, publish, or disclose any information with third parties.
External service (1)
The Stop Bad Bots plugin will retrieve tips and news from our site BillMinozzi.com. This information will be displayed in the plugin dashboard, in the right-hand column under the title “Tips and News.” No data is sent to our server. Learn about the terms of use for our plugins and themes at this link:
https://siterightaway.net/terms-of-use-of-our-plugins-and-themes/


