Arvexa Performance Overlay Wordpress Plugin - Rating, Reviews, Demo & Download

Plugin Description
Arvexa Performance Overlay shows a small pill in the corner of every page — for administrators only. Click it and you get a live panel with everything that matters about the page you are looking at:
- Server — PHP generation time, SQL query count and total time, peak memory, number of enqueued scripts and styles, total size of autoloaded options, and the lifecycle phase that ate the biggest share of PHP time.
- Components — the cost of every plugin and theme on this page: SQL queries and time on the server side, requests and transferred bytes on the asset side. The answer to “which plugin slowed us down” in one glance.
- Network — TTFB, request count, transferred bytes.
- Rendering — LCP (and which element it is), CLS, INP, DOM node count, long tasks. Official Web Vitals thresholds, color-coded.
- AJAX / REST — every same-origin admin-ajax, wc-ajax and REST call timed as it happens.
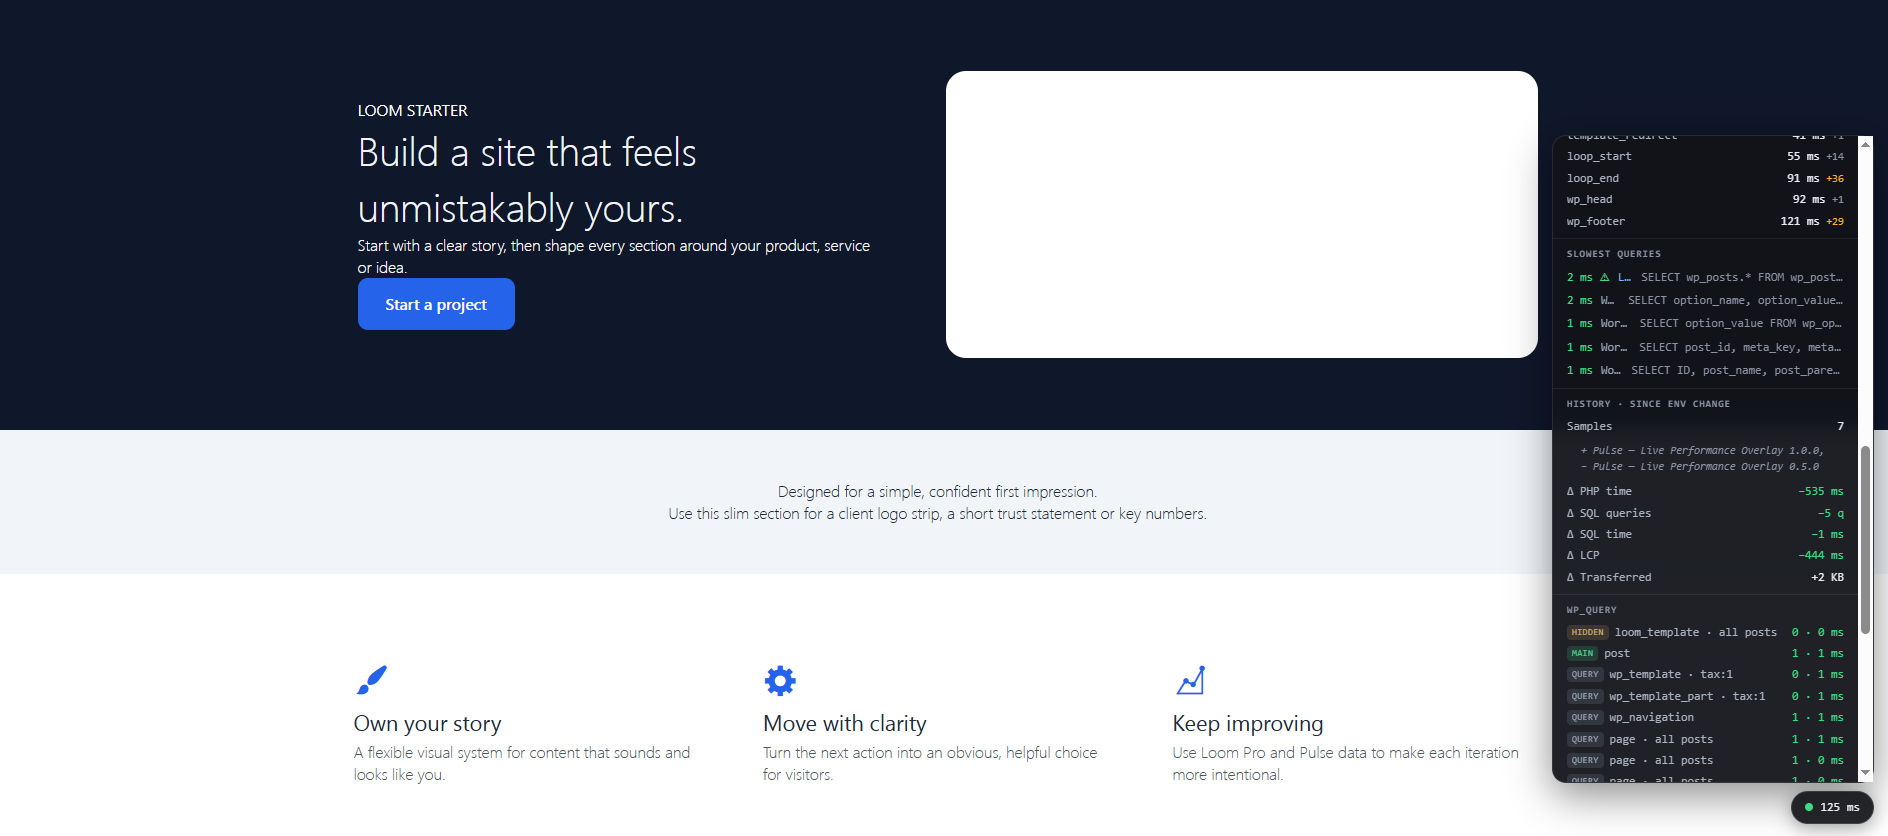
- Slowest queries — the top queries with timings.
How it works
- Per-query plugin attribution uses the
log_query_custom_datafilter and a backtrace scan — no core hacks, no db.php drop-in. - The plugin never enables or changes
SAVEQUERIES. To collect query timings, a site administrator may explicitly adddefine( 'SAVEQUERIES', true );towp-config.phpbefore the “That’s all, stop editing!” line. - Visitors are never affected: for anyone without the capability the plugin adds no assets, no queries and no output.
- Add-ons can extend the panel via the
arvexa_performance_overlay_dataPHP filter and thewindow.ArvexaPerformanceOverlayJS API.
Arvexa Performance Pro
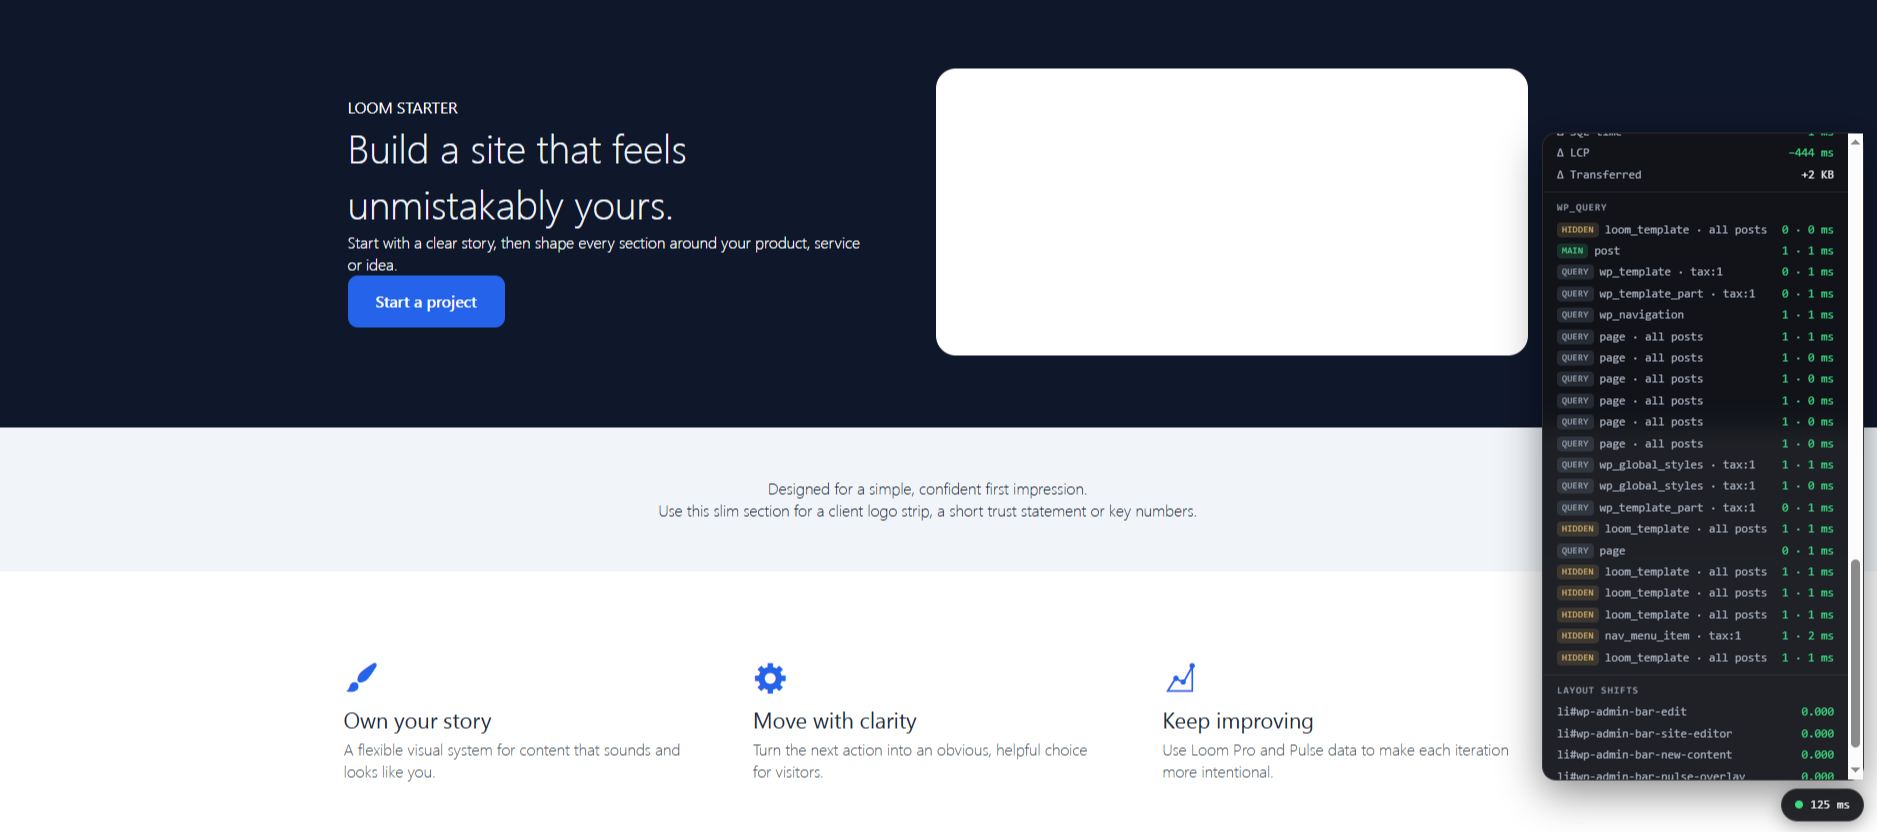
Deep diagnostics live in the Arvexa Performance Pro add-on: full hook timeline, server cost of every AJAX/REST call (X-Arvexa-Performance header), remote HTTP tracking (see what your shipping/payment APIs cost), WP_Query explorer with SQL and EXPLAIN, per-plugin drill-down cards, layout-shift attribution per element, and performance history with before/after comparison when a plugin is installed or updated.
Screenshots
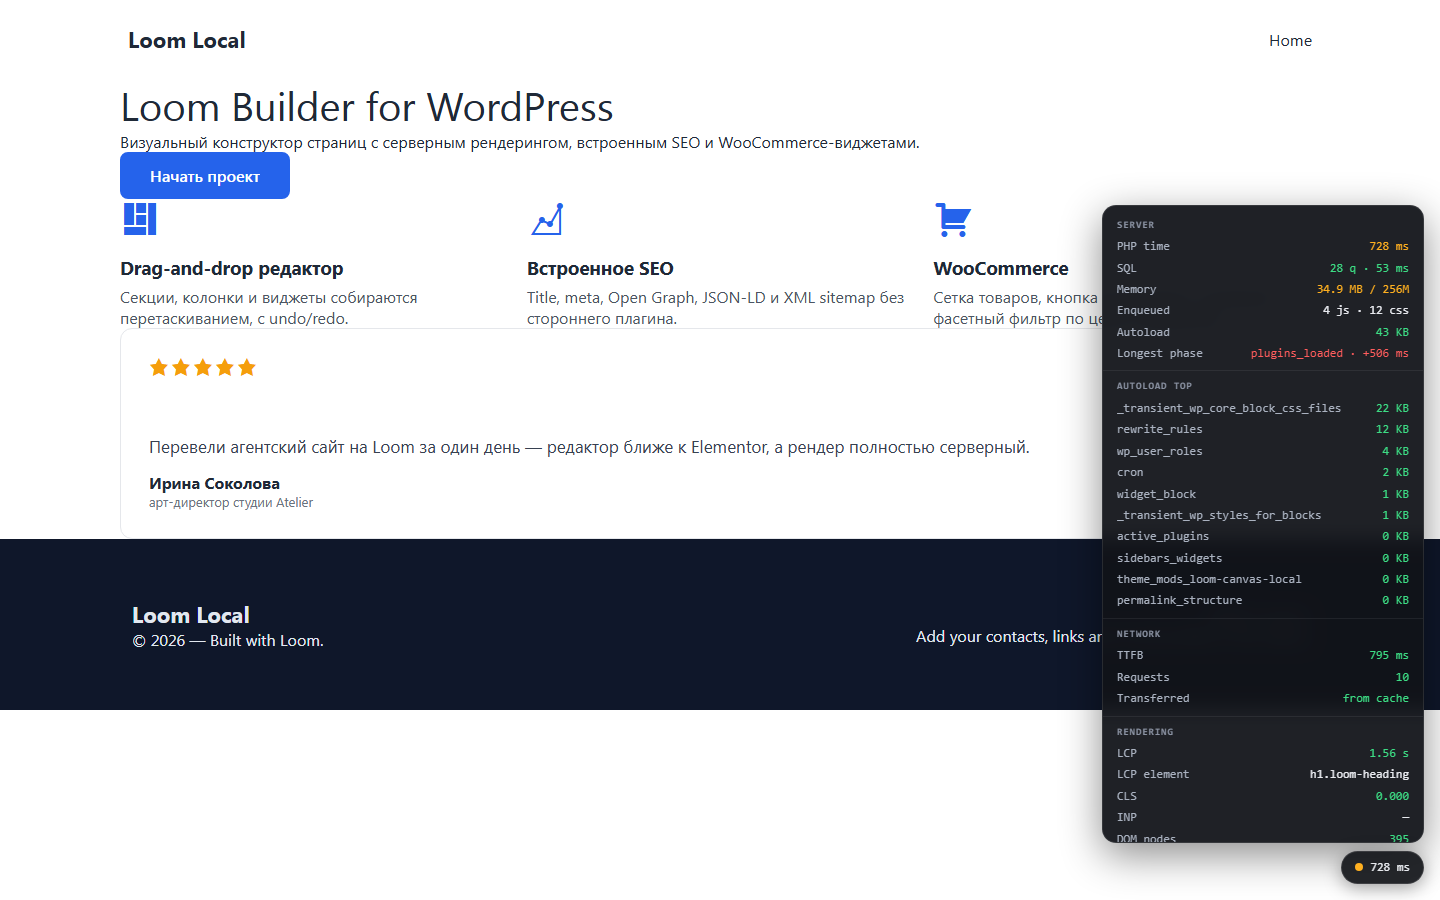
The overlay panel: Server, Network, Rendering and Components at a glance.
Components — per-plugin SQL and asset cost.
Slowest queries with timings.
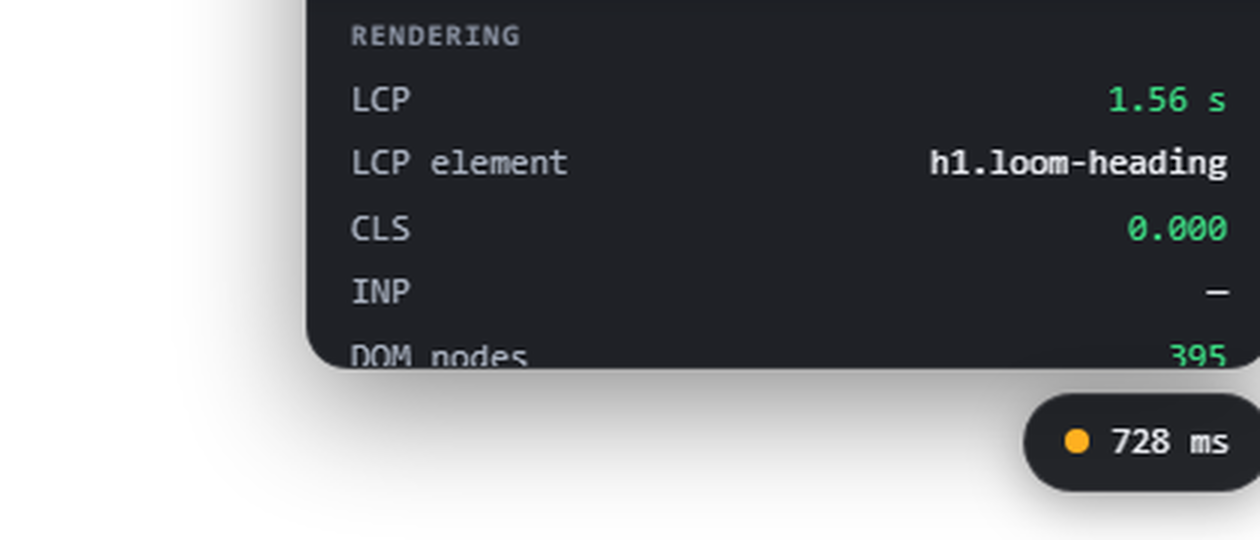
The pill — the only thing visible until you need more.